INVITE-ONLY SCRIPT
Multi-Symbol Options Trading Indicator
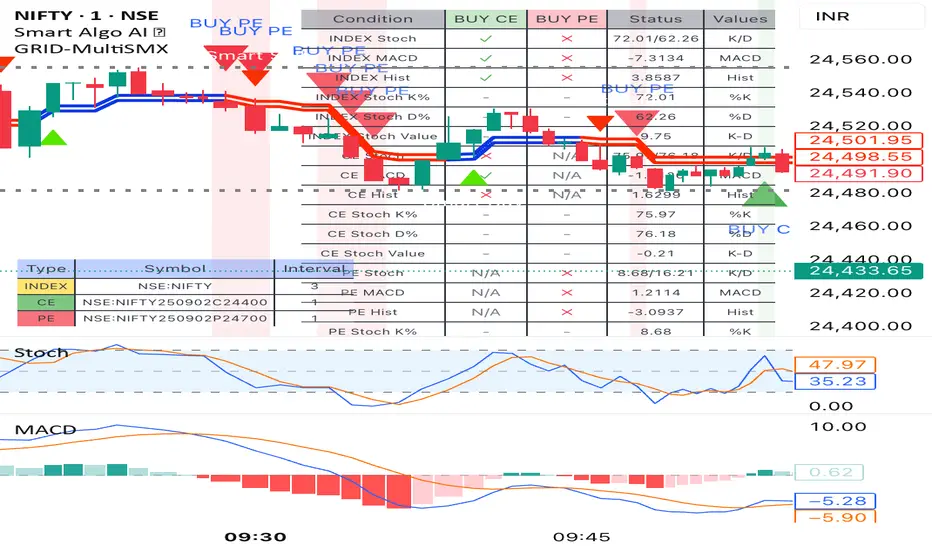
Symbol Configuration: User can input three different symbols (INDEX, CE, PE) with individual timeframes
Customizable Settings: Fully editable MACD and Stochastic parameters
Signal Generation:
BUY CE: When INDEX shows bullish signals AND CE option shows bullish signals
BUY PE: When INDEX shows bearish signals AND PE option shows bullish signals
Signal Conditions:
BUY CE Signal (all must be true):
INDEX: Stochastic %K > %D
INDEX: MACD line > Signal line
INDEX: Histogram shows bullish trend over specified bars
CE: Stochastic %K > %D
CE: MACD line > Signal line
CE: Histogram shows bullish trend over specified bars
BUY PE Signal (all must be true):
INDEX: Stochastic %K < %D
INDEX: MACD line < Signal line
INDEX: Histogram shows bearish trend over specified bars
PE: Stochastic %K > %D
PE: MACD line > Signal line
PE: Histogram shows bullish trend over specified bars
Visual Elements:
Green triangle up with "BUY CE" text when CE signal triggers
Red triangle down with "BUY PE" text when PE signal triggers
Background coloring on signal candles
Conditions table showing real-time status of all conditions
Alerts for both signal types
Usage Instructions:
Add the indicator to your chart
Configure your three symbols (INDEX, CE option, PE option)
Set timeframes for each symbol
Adjust MACD and Stochastic parameters as needed
Set the number of histogram bars for trend analysis
Enable/disable the conditions table and choose its position
The table will show you exactly which conditions are met (✓) or not met (✗) for both signal types, making it easy to monitor the setup in real-time.
仅限邀请脚本
只有作者授权的用户才能访问此脚本。您需要申请并获得使用许可。通常情况下,付款后即可获得许可。更多详情,请按照下方作者的说明操作,或直接联系sailor_joe。
TradingView不建议您付费购买或使用任何脚本,除非您完全信任其作者并了解其工作原理。您也可以在我们的社区脚本找到免费的开源替代方案。
作者的说明
Pls mail josegejo@gmail.com or contact +91 9846040278
免责声明
这些信息和出版物并非旨在提供,也不构成TradingView提供或认可的任何形式的财务、投资、交易或其他类型的建议或推荐。请阅读使用条款了解更多信息。
仅限邀请脚本
只有作者授权的用户才能访问此脚本。您需要申请并获得使用许可。通常情况下,付款后即可获得许可。更多详情,请按照下方作者的说明操作,或直接联系sailor_joe。
TradingView不建议您付费购买或使用任何脚本,除非您完全信任其作者并了解其工作原理。您也可以在我们的社区脚本找到免费的开源替代方案。
作者的说明
Pls mail josegejo@gmail.com or contact +91 9846040278
免责声明
这些信息和出版物并非旨在提供,也不构成TradingView提供或认可的任何形式的财务、投资、交易或其他类型的建议或推荐。请阅读使用条款了解更多信息。