OPEN-SOURCE SCRIPT
Regime Kaleidoscope
What is Regime Kaleidoscope?
Regime Kaleidoscope is an advanced market regime visualizer and adaptive signal generator.
It helps traders instantly understand whether current market conditions are best for mean-reversion (fading price back to the mean) or breakout/trend-following (riding strong moves), using a data-driven, non-repainting approach.
How It Works
1. Regime Detection & Background Colors
The indicator analyzes both volatility (ATR) and the shape of each candle (body size vs. range) over a rolling window.
Each bar is classified into one of three regimes, and the chart’s background color changes accordingly:
Regime Background Color What It Means How to Use
Low Vol Balanced Green background Market is calm, compressed. More likely to revert back to mean. Look for mean-reversion signals only (fade moves).
High Vol Directional Red background Market is in a high-volatility, trending, or “breakout” state.
Red does NOT mean bearish. It simply means conditions are ripe for strong directional moves—either up or down. Look for breakout signals only (ride strong moves after structure break).
Chop Gray background Market is indecisive or transitioning between states. Signals are minimized or blocked. Best to wait or trade with extra caution.
→ Red background means high volatility/trending regime, not a signal direction!
Green means “mean-revert environment,” not always bullish!
Gray means “chop/transition”—usually best avoided.
2. Signals — How to Read and Trade Them
Mean-Reversion Signals (Green Regime Only):
Appear when price is stretched away from a rolling mean (SMA) by a configurable ATR-based threshold.
Optional: Only allowed in the direction of the higher-timeframe trend, if enabled.
Long signals: Fade extreme dips (look for triangle-up shapes & green labels).
Short signals: Fade extreme spikes (triangle-down shapes & red labels).
Labels show signal strength (distance from mean in ATR units).
Breakout Signals (Red Regime Only):
Only triggered when price breaks above or below a confirmed swing high or low (pivot), with a strong candle and optional trend confirmation.
Long signals: Breakout above last swing high (regardless of background color).
Short signals: Breakout below last swing low.
Labels show signal strength (distance from pivot in ATR units).
Red background does NOT mean sell— it means “trend environment”—so both long and short signals are possible, depending on which direction price is breaking out.
Signal Controls & Filtering:
Signals only fire at bar close (non-repainting), never intrabar or on future data.
ATR “floor” blocks signals when volatility is too low for meaningful moves.
Cooldown: Signals are limited to one per regime per direction for a minimum number of bars (user input).
Optional confirmation candles: Only strong reversals or breakouts count, reducing noise and whipsaws.
All signals are visible as triangle shapes below/above bars, and labeled with strength.
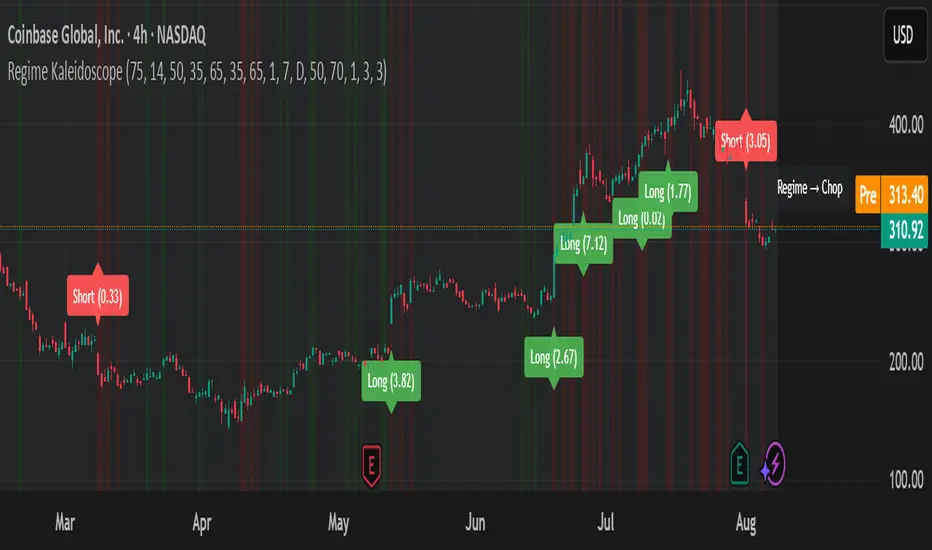
3. Visual Guide
Background color: Maps the regime, not buy/sell direction.
Transition label: Appears only when the regime changes, so you can see state shifts at a glance.
Triangle shapes & labels: Mark entry points; label gives strength.
Info table (optional): Shows regime and ATR at transitions.
Why is Regime Kaleidoscope Unique?
Uses rolling statistical percentiles of ATR and candle body shape for dynamic market state detection—not just a moving average or volatility band.
Separates regime from signal direction, so you always know “what mode the market is in” and when signals actually have a higher probability.
No repainting. All logic is strictly bar-close, confirmed pivots, and non-future-leaking.
Highly customizable—all thresholds, filters, trend confirmation, and cooldown are user inputs.
How To Use
Add to any chart.
Use the background color to identify if you’re in a mean-revert, breakout, or chop regime.
Take only the signals that match the regime:
Green = fade extremes, Red = ride breakouts, Gray = wait.
Tune settings for your asset and timeframe.
All signals are educational—always test before live use!
Past performance is not necessarily indicative of future results.
Test the indicator on your assets and timeframes. All signals are for educational use only.
Regime Kaleidoscope is an advanced market regime visualizer and adaptive signal generator.
It helps traders instantly understand whether current market conditions are best for mean-reversion (fading price back to the mean) or breakout/trend-following (riding strong moves), using a data-driven, non-repainting approach.
How It Works
1. Regime Detection & Background Colors
The indicator analyzes both volatility (ATR) and the shape of each candle (body size vs. range) over a rolling window.
Each bar is classified into one of three regimes, and the chart’s background color changes accordingly:
Regime Background Color What It Means How to Use
Low Vol Balanced Green background Market is calm, compressed. More likely to revert back to mean. Look for mean-reversion signals only (fade moves).
High Vol Directional Red background Market is in a high-volatility, trending, or “breakout” state.
Red does NOT mean bearish. It simply means conditions are ripe for strong directional moves—either up or down. Look for breakout signals only (ride strong moves after structure break).
Chop Gray background Market is indecisive or transitioning between states. Signals are minimized or blocked. Best to wait or trade with extra caution.
→ Red background means high volatility/trending regime, not a signal direction!
Green means “mean-revert environment,” not always bullish!
Gray means “chop/transition”—usually best avoided.
2. Signals — How to Read and Trade Them
Mean-Reversion Signals (Green Regime Only):
Appear when price is stretched away from a rolling mean (SMA) by a configurable ATR-based threshold.
Optional: Only allowed in the direction of the higher-timeframe trend, if enabled.
Long signals: Fade extreme dips (look for triangle-up shapes & green labels).
Short signals: Fade extreme spikes (triangle-down shapes & red labels).
Labels show signal strength (distance from mean in ATR units).
Breakout Signals (Red Regime Only):
Only triggered when price breaks above or below a confirmed swing high or low (pivot), with a strong candle and optional trend confirmation.
Long signals: Breakout above last swing high (regardless of background color).
Short signals: Breakout below last swing low.
Labels show signal strength (distance from pivot in ATR units).
Red background does NOT mean sell— it means “trend environment”—so both long and short signals are possible, depending on which direction price is breaking out.
Signal Controls & Filtering:
Signals only fire at bar close (non-repainting), never intrabar or on future data.
ATR “floor” blocks signals when volatility is too low for meaningful moves.
Cooldown: Signals are limited to one per regime per direction for a minimum number of bars (user input).
Optional confirmation candles: Only strong reversals or breakouts count, reducing noise and whipsaws.
All signals are visible as triangle shapes below/above bars, and labeled with strength.
3. Visual Guide
Background color: Maps the regime, not buy/sell direction.
Transition label: Appears only when the regime changes, so you can see state shifts at a glance.
Triangle shapes & labels: Mark entry points; label gives strength.
Info table (optional): Shows regime and ATR at transitions.
Why is Regime Kaleidoscope Unique?
Uses rolling statistical percentiles of ATR and candle body shape for dynamic market state detection—not just a moving average or volatility band.
Separates regime from signal direction, so you always know “what mode the market is in” and when signals actually have a higher probability.
No repainting. All logic is strictly bar-close, confirmed pivots, and non-future-leaking.
Highly customizable—all thresholds, filters, trend confirmation, and cooldown are user inputs.
How To Use
Add to any chart.
Use the background color to identify if you’re in a mean-revert, breakout, or chop regime.
Take only the signals that match the regime:
Green = fade extremes, Red = ride breakouts, Gray = wait.
Tune settings for your asset and timeframe.
All signals are educational—always test before live use!
Past performance is not necessarily indicative of future results.
Test the indicator on your assets and timeframes. All signals are for educational use only.
开源脚本
秉承TradingView的精神,该脚本的作者将其开源,以便交易者可以查看和验证其功能。向作者致敬!您可以免费使用该脚本,但请记住,重新发布代码须遵守我们的网站规则。
免责声明
这些信息和出版物并非旨在提供,也不构成TradingView提供或认可的任何形式的财务、投资、交易或其他类型的建议或推荐。请阅读使用条款了解更多信息。
免责声明
这些信息和出版物并非旨在提供,也不构成TradingView提供或认可的任何形式的财务、投资、交易或其他类型的建议或推荐。请阅读使用条款了解更多信息。