OPEN-SOURCE SCRIPT
Session Candles
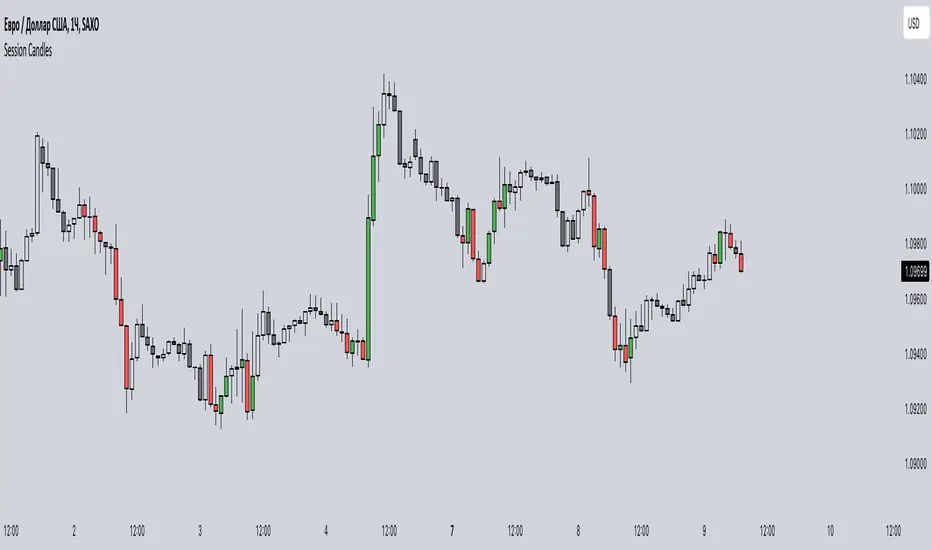
This indicator is designed to visually represent different trading sessions on a price chart, highlighting candlestick colors to distinguish between bullish (upward movement) and bearish (downward movement) trends during various market sessions. Here's an overview of how the indicator works:
1. Session Definition: The indicator defines four distinct trading sessions:
- London Session: Typically covering the European trading hours.
- New York AM Session: Representing the morning hours of the New York trading session.
- New York PM Session: Representing the afternoon hours of the New York trading session.
- Asia Session: Encompassing the trading hours of the Asian markets.
2. Configuration Options: Users can customize the behavior of the indicator through input options. For each session, users can enable or disable the display of session-specific candles.
3. Candle Coloring: The indicator determines the color of candles based on the following criteria:
- For each session, it checks whether the current candle's closing price is higher than its opening price.
- If the closing price is higher, the candle is considered bullish, and a user-defined green color is used for the candle.
- If the closing price is lower, the candle is considered bearish, and a user-defined red color is applied.
4. Display: The indicator then applies the calculated candle colors to the respective candles of each trading session on the price chart. This visual distinction helps traders quickly identify the prevailing trend during different market sessions.
To use the indicator, traders can overlay it on their price charts in TradingView. By enabling or disabling specific trading sessions, they can focus on the trends and price movements during those specific time periods.
Please note that the actual appearance of the indicator on the chart depends on the user's chosen settings for session enablement and color preferences.
开源脚本
秉承TradingView的精神,该脚本的作者将其开源,以便交易者可以查看和验证其功能。向作者致敬!您可以免费使用该脚本,但请记住,重新发布代码须遵守我们的网站规则。
免责声明
这些信息和出版物并非旨在提供,也不构成TradingView提供或认可的任何形式的财务、投资、交易或其他类型的建议或推荐。请阅读使用条款了解更多信息。
免责声明
这些信息和出版物并非旨在提供,也不构成TradingView提供或认可的任何形式的财务、投资、交易或其他类型的建议或推荐。请阅读使用条款了解更多信息。