INVITE-ONLY SCRIPT
HuD Bursa Time Range ( TR )

HuD Bursa Time Range ( TR ):
🔘 Is a simple indicator that makes it easier for intraday traders to make daily decisions.
🔘 The concept is simple.
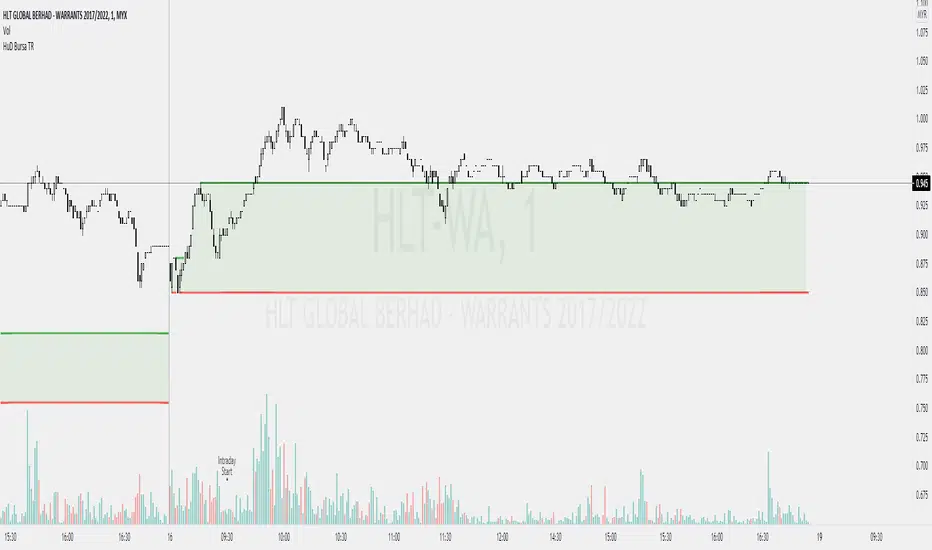
🔘 Between 9am - 9.30am (default value) I call this the Time Range (TR).
🔘 This TR time is also the time where traders (the day before) selling their shares.
🔘 After this period, usually new traders will take their position and look for entries.
🔸 If the next candle does not close below this TR lowest price. then there is a possibility the candle will move upwards.
🔸 If the next candle is higher than the high candle from TR, the candle will most likely make a Breakout (BO) & the daily candle will form a green candle / marobozu. = background will turn green
🔸 The background will turn yellow, if the close candle at the end of the session is equal to the open price
🔘 This Indi only applies for timeframes (TF) lower than Daily (Ex: TF4hour, TF1hour, TF30min, TF15min, 1min etc).
🔘 It is recommended to use this indi in TF1 minutes, so that it works like a tick chart on the trading platform.

Examples 1 :

Examples 2 :

Examples 3 :

Examples 4 :
🔘 Is a simple indicator that makes it easier for intraday traders to make daily decisions.
🔘 The concept is simple.
🔘 Between 9am - 9.30am (default value) I call this the Time Range (TR).
🔘 This TR time is also the time where traders (the day before) selling their shares.
🔘 After this period, usually new traders will take their position and look for entries.
🔸 If the next candle does not close below this TR lowest price. then there is a possibility the candle will move upwards.
🔸 If the next candle is higher than the high candle from TR, the candle will most likely make a Breakout (BO) & the daily candle will form a green candle / marobozu. = background will turn green
🔸 The background will turn yellow, if the close candle at the end of the session is equal to the open price
🔘 This Indi only applies for timeframes (TF) lower than Daily (Ex: TF4hour, TF1hour, TF30min, TF15min, 1min etc).
🔘 It is recommended to use this indi in TF1 minutes, so that it works like a tick chart on the trading platform.
Examples 1 :
Examples 2 :
Examples 3 :
Examples 4 :
免责声明
这些信息和出版物并非旨在提供,也不构成TradingView提供或认可的任何形式的财务、投资、交易或其他类型的建议或推荐。请阅读使用条款了解更多信息。