INVITE-ONLY SCRIPT
Zippo Blaze Crypto
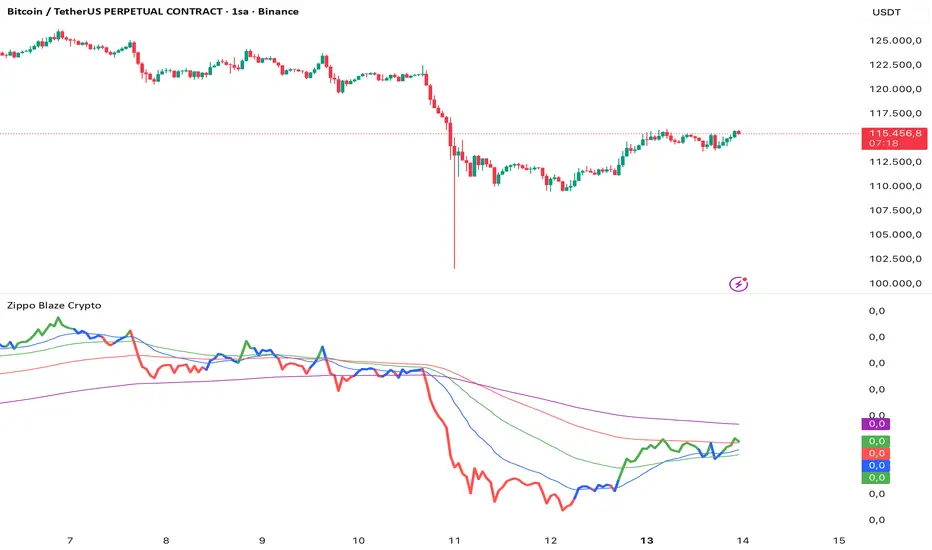
Zippo Blaze Crypto
An advanced trend-following indicator that analyzes cryptocurrency price movements by integrating them with major pairs (BTC, ETH, BNB, etc.). It combines the price with these pairs and overall market dynamics to create a main line, colors this line based on momentum, and adds user-adjustable EMAs on top. This provides a balanced trend analysis by considering connections in the crypto market. It only works for cryptocurrencies; it shows no data for other assets (e.g., Borsa Istanbul stocks).
How It Works?
This system operates using a special method that combines crypto prices with major pairs (like BTC, ETH, BNB) and the price itself:
- Price Movement Line: The main line created by normalizing the crypto price with pairs and market data – it shows movement with major coins, but moves in tandem with the price (the line rises when the price rises, falls when it falls) and synchronizes with pairs.
-- Coloring: Determined based on momentum:
🟢 Green: Upward momentum – upward price movement expected.
🔴 Red: Downward momentum – downward price movement expected.
🔵 Blue: Neutral zone – horizontal movement or uncertainty period.
-- EMAs: Moving averages added on top of the main line (EMA 20, 50, 100, 200). Periods can be changed by the user; other calculations are fixed.
This method strengthens signals by utilizing the interconnected structure of the market and reduces optimization risk.
Key Features:
Pair Integration: Integrates price movement with major pairs like BTC, ETH, BNB, providing a connected view instead of an isolated analysis.
Momentum Coloring: Colors the line for quick trend detection – green and red zones give clear signals.
Verification Tools: EMAs verify the direction of the main line; for example, EMAs turning upward can be used as a long signal, downward as a short signal.
Price Action Levels: When viewed on larger time frames (daily, weekly), important support/resistance levels (PA levels) become more apparent.
Crypto-Focused: Only activates on crypto symbols; remains blank in other markets.
How to Use?
-- Price Movement Line: Main trend indicator – moves in sync with pairs, signals long opportunities in uptrends, short in downtrends.
🟢 Green Line: Upward movement expected (evaluate long positions).
🔴 Red Line: Downward movement expected (evaluate short positions).
🔵 Blue Line: Horizontal or neutral period – avoid opening new positions.
- EMAs: Line and EMA crossovers confirm signals; EMAs turning upward can be interpreted as a long signal, downward as short. Monitor PA levels with EMAs on larger periods.
Time Frame and Usage Recommendations
Best results are achieved on hourly and higher time frames (e.g., 1H, 4H, daily), as pair integration and price movement are clearer in these frames.
Signals may weaken in low-liquidity altcoins; ideal for major cryptocurrencies (BTC, ETH, BNB, etc.).
Use EMAs to detect PA levels on larger periods (daily+) – this provides an advantage in long-term trades.
In short time frames, adjust EMA periods for filtering.
Important Warning
This indicator is developed for technical analysis purposes and does not contain investment advice. Market conditions can change rapidly; even pair integration cannot provide full protection against instant fluctuations. Make all your investment decisions based on your own research, risk management strategies, and professional advice.
仅限邀请脚本
只有经作者批准的用户才能访问此脚本。您需要申请并获得使用权限。该权限通常在付款后授予。如需了解更多详情,请按照以下作者的说明操作,或直接联系Zippo_Javie。
除非您完全信任其作者并了解脚本的工作原理,否則TradingView不建议您付费或使用脚本。您还可以在我们的社区脚本中找到免费的开源替代方案。
作者的说明
Access Request: This indicator is published as invite-only (access by invitation only). To request access, please message me at https://x.com/bist_imkb. I can provide details on paid access options.
免责声明
这些信息和出版物并不意味着也不构成TradingView提供或认可的金融、投资、交易或其它类型的建议或背书。请在使用条款阅读更多信息。