PROTECTED SOURCE SCRIPT
Buy/Sell Volume VWAP with Liquidity and Price Sensitivity
Buy/Sell Volume VWAP with Liquidity & Price Sensitivity
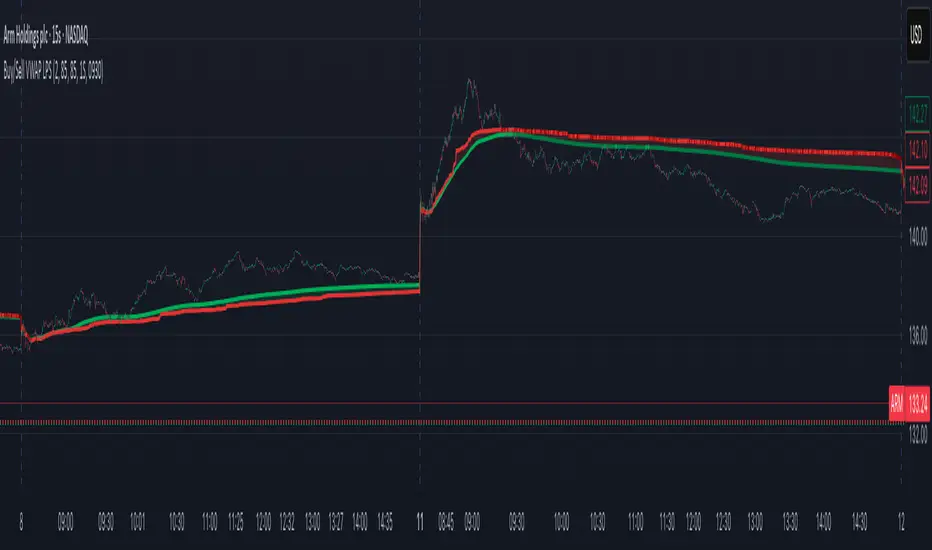
A dual-VWAP overlay that separates buy-side vs sell-side pressure using lower-timeframe volume and recent price behavior. It shows two adaptive VWAP lines and a bias cloud to make trend and imbalance easy to see—no params fussing required.
What you’ll see
Buy VWAP (green) and Sell VWAP (red) plotted on the chart
Slope-aware coloring: brighter when that side is improving, darker when easing
Bias cloud: green when Buy > Sell, red when Sell > Buy
Optional last-value bubbles on the price scale for quick readouts
How it works
Looks inside each bar (lower timeframe, e.g., 1-second) to estimate buy vs sell pressure
Blends that pressure with recent price movement to keep the lines responsive but stable
Maintains separate VWAP tracks for buy-side and sell-side and resets daily or at a time you choose
How to use it
Trend & bias: When Buy VWAP stays above Sell VWAP (green cloud), buyers have the upper hand; the opposite (red cloud) favors sellers.
Conviction: A wider gap between the two lines often means a stronger imbalance.
Context: Use alongside structure (higher highs/lows, key levels) for confirmation—this is not a stand-alone signal.
Inputs
Timeframe: Lower-TF sampling (default 1S).
Reset Time: Defaults to 09:30 (session open); set to your market.
Appearance: Two-shade palettes for buy/sell, line width, last-value bubbles, and cloud opacity.
Tips
Works on most symbols and intraday timeframes; lower-TF sampling can be heavier on resources.
If the cloud flips frequently, consider viewing on a slightly higher chart timeframe for cleaner structure.
Disclaimer
For educational use only. Not investment advice. Test on replay/paper before live decisions.


https://www.tradingview.com/x/xLOyisX6/
A dual-VWAP overlay that separates buy-side vs sell-side pressure using lower-timeframe volume and recent price behavior. It shows two adaptive VWAP lines and a bias cloud to make trend and imbalance easy to see—no params fussing required.
What you’ll see
Buy VWAP (green) and Sell VWAP (red) plotted on the chart
Slope-aware coloring: brighter when that side is improving, darker when easing
Bias cloud: green when Buy > Sell, red when Sell > Buy
Optional last-value bubbles on the price scale for quick readouts
How it works
Looks inside each bar (lower timeframe, e.g., 1-second) to estimate buy vs sell pressure
Blends that pressure with recent price movement to keep the lines responsive but stable
Maintains separate VWAP tracks for buy-side and sell-side and resets daily or at a time you choose
How to use it
Trend & bias: When Buy VWAP stays above Sell VWAP (green cloud), buyers have the upper hand; the opposite (red cloud) favors sellers.
Conviction: A wider gap between the two lines often means a stronger imbalance.
Context: Use alongside structure (higher highs/lows, key levels) for confirmation—this is not a stand-alone signal.
Inputs
Timeframe: Lower-TF sampling (default 1S).
Reset Time: Defaults to 09:30 (session open); set to your market.
Appearance: Two-shade palettes for buy/sell, line width, last-value bubbles, and cloud opacity.
Tips
Works on most symbols and intraday timeframes; lower-TF sampling can be heavier on resources.
If the cloud flips frequently, consider viewing on a slightly higher chart timeframe for cleaner structure.
Disclaimer
For educational use only. Not investment advice. Test on replay/paper before live decisions.
https://www.tradingview.com/x/xLOyisX6/
受保护脚本
此脚本以闭源形式发布。 但是,您可以自由使用,没有任何限制 — 了解更多信息这里。
免责声明
这些信息和出版物并非旨在提供,也不构成TradingView提供或认可的任何形式的财务、投资、交易或其他类型的建议或推荐。请阅读使用条款了解更多信息。
免责声明
这些信息和出版物并非旨在提供,也不构成TradingView提供或认可的任何形式的财务、投资、交易或其他类型的建议或推荐。请阅读使用条款了解更多信息。