OPEN-SOURCE SCRIPT
已更新 Webby's RSI (Really Simple Indicator) [LevelUp]
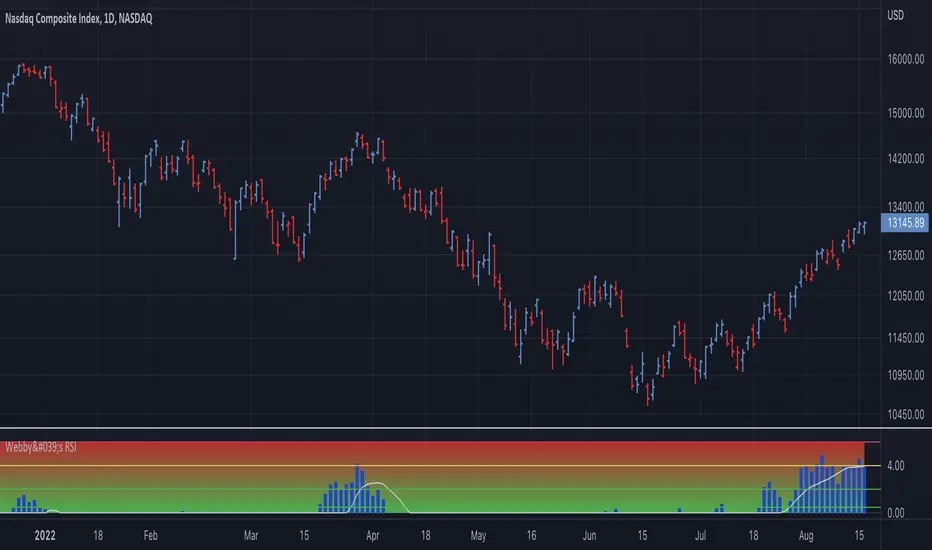
Webby's RSI (Really Simple Indicator) is a technical indicator designed to gauge the health of an uptrend. The concept and original implementation was created by Mike Webster, previously a portfolio manager for William O'Neil, founder of Investor's Business Daily.
Most often used with the Nasdaq Composite (IXIC), Webby's RSI is the percentage of the low versus the 21-day moving average. At the beginning of a bull market, the higher the value, the better, as we want to see power.
Using the zones shown on the chart:
0.5% and 2.0% - Ideal
2.0% to 4.0% - Caution
4.0%+ - Warning
版本注释
Version 2.0▪ Optional background color shown as a gradient.
▪ Customize plot type, color & moving average.
▪ Show/hide zone lines.
开源脚本
秉承TradingView的精神,该脚本的作者将其开源,以便交易者可以查看和验证其功能。向作者致敬!您可以免费使用该脚本,但请记住,重新发布代码须遵守我们的网站规则。
Join traders in over 40 countries and LevelUp!
tradingview.com/spaces/LevelUpTools/
tradingview.com/spaces/LevelUpTools/
免责声明
这些信息和出版物并非旨在提供,也不构成TradingView提供或认可的任何形式的财务、投资、交易或其他类型的建议或推荐。请阅读使用条款了解更多信息。
开源脚本
秉承TradingView的精神,该脚本的作者将其开源,以便交易者可以查看和验证其功能。向作者致敬!您可以免费使用该脚本,但请记住,重新发布代码须遵守我们的网站规则。
Join traders in over 40 countries and LevelUp!
tradingview.com/spaces/LevelUpTools/
tradingview.com/spaces/LevelUpTools/
免责声明
这些信息和出版物并非旨在提供,也不构成TradingView提供或认可的任何形式的财务、投资、交易或其他类型的建议或推荐。请阅读使用条款了解更多信息。