OPEN-SOURCE SCRIPT
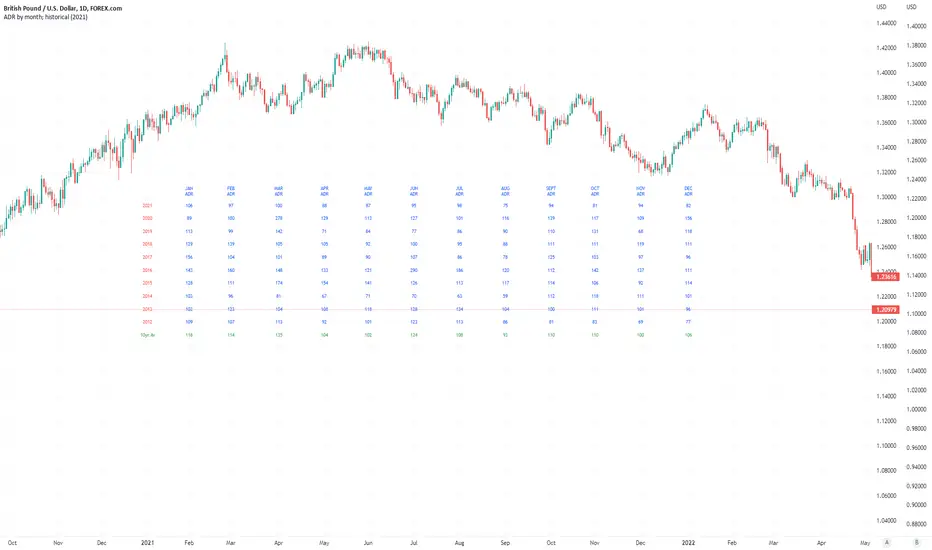
已更新 Average Daily Pip Ranges by month

Shows historical average daily pip ranges for specific months for FOREX pairs
useful for guaging typical seasonal volatility; or rough expected daily pip ranges for different months
works on both DXY and foreign currencies
option to plot 10yrs worth of data; with 10yr average of the average daily range for specific months
cast back to any previous 10yrs of your choosing
twingall
版本注释
Added precision (decimal places) option. Added support for BTC, ETH, S&P, NASDAQ. Added option for user to input multiplier when the asset is not defined. Added Tooltip.版本注释
Updates:-Using Tables for neater display; user options for text size, color and table position.
-Option for custom number of lookback years to display(0-10).
-Option to show 10yr averages or not (10yrs back from the input start year).
-Added averaging function to account for NaN values: if current month of start year has not yet elapsed, 9yr average will be displayed, otherwise 10yr average.
开源脚本
秉承TradingView的精神,该脚本的作者将其开源,以便交易者可以查看和验证其功能。向作者致敬!您可以免费使用该脚本,但请记住,重新发布代码须遵守我们的网站规则。
You can buy me a coffee here...
PayPal.Me/twingall
BTC: 3JrhUwNRnKyqhaa1n1AXKeAubNeEFoch6S
ETH erc20: 0x4b0400B1c18503529ab69611e82a934DDe4Ab038
ETH bep20: 0x1F0f03F184079bb1085F8C9dF3a8191C9f5869B3
PayPal.Me/twingall
BTC: 3JrhUwNRnKyqhaa1n1AXKeAubNeEFoch6S
ETH erc20: 0x4b0400B1c18503529ab69611e82a934DDe4Ab038
ETH bep20: 0x1F0f03F184079bb1085F8C9dF3a8191C9f5869B3
免责声明
这些信息和出版物并非旨在提供,也不构成TradingView提供或认可的任何形式的财务、投资、交易或其他类型的建议或推荐。请阅读使用条款了解更多信息。