OPEN-SOURCE SCRIPT
PulseWave Strategy Markking77
PulseWave Strategy (Markking77) — Description & Indicator Roadmap
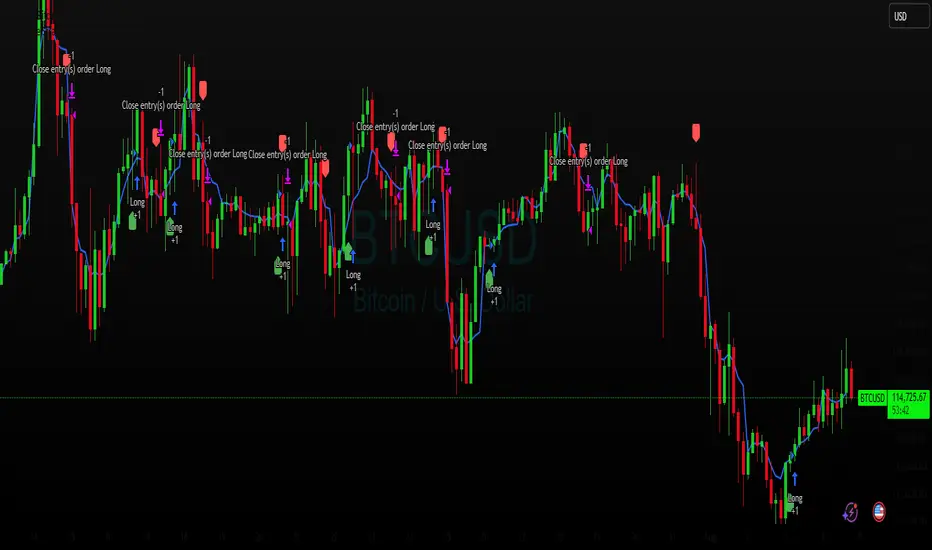
PulseWave Strategy (Markking77) is a sleek, straightforward trading system that fuses three powerful market indicators — VWAP, MACD, and RSI — into one harmonious tool. Designed for traders who want clear, actionable signals, this strategy captures trend direction, momentum shifts, and market strength to help you spot optimal entry and exit points.
Step 1: VWAP — The Market Trend Compass (Color: Blue)
What it does:
The Volume Weighted Average Price (VWAP) is the average price a security has traded at throughout the day, weighted by volume. It acts as a dynamic benchmark that many institutional traders rely on.
Why it matters:
Price above the VWAP (blue line) signals bullish momentum — buyers dominate.
Price below the VWAP signals bearish momentum — sellers in control.
PulseWave use:
VWAP sets the trend foundation — we trade in the direction the price sits relative to VWAP.
Step 2: MACD — Momentum Confirmation (Colors: Orange & Blue)
What it does:
MACD tracks momentum by comparing short-term and long-term moving averages, using the MACD line and a signal line to indicate shifts.
Why it matters:
When the MACD line (orange) crosses above the Signal line (blue), it signals rising momentum — a bullish cue.
When the MACD line crosses below the signal line, it signals weakening momentum — bearish cue.
PulseWave use:
MACD confirms momentum that aligns with the VWAP trend before entering trades.
Step 3: RSI — The Strength Filter (Color: Purple)
What it does:
The Relative Strength Index (RSI) measures how fast prices are changing to indicate overbought or oversold conditions.
Why it matters:
RSI above 70 = overbought (possible reversal or pause).
RSI below 30 = oversold (potential bounce).
PulseWave use:
RSI filters out trades taken at extreme price levels, avoiding entries that are too stretched.
Color-Coded Roadmap Summary:
Step Indicator Role Buy Signal Sell Signal Color
1 VWAP Trend Direction Price > VWAP (bullish) Price < VWAP (bearish) Blue
2 MACD Momentum Confirmation MACD line crosses above Signal line MACD line crosses below Signal line Orange & Blue
3 RSI Entry Filter RSI < 70 (not overbought) RSI > 30 (not oversold) Purple
How PulseWave Strategy Works:
Buy when price sits above VWAP, MACD line crosses above the Signal line, and RSI is below 70.
Sell (exit) when price drops below VWAP, MACD line crosses below the Signal line, and RSI is above 30.
This layered approach ensures you only trade when trend, momentum, and strength align — reducing false signals and improving your edge.
Why Use PulseWave Strategy?
Clear & Simple: No guesswork — clear color-coded signals guide your decisions.
Robust: Combines trend, momentum, and strength in one system.
Versatile: Fits day trading and swing trading styles alike.
Visual: Easily interpreted signals with minimal clutter.
开源脚本
本着TradingView的真正精神,此脚本的创建者将其开源,以便交易者可以查看和验证其功能。向作者致敬!虽然您可以免费使用它,但请记住,重新发布代码必须遵守我们的网站规则。
Check my performance t.me/Forexcryptoaccountms
My Channel link
Check my performance t.me/forxsignal79
My Channel link
My Channel link
Check my performance t.me/forxsignal79
My Channel link
免责声明
这些信息和出版物并不意味着也不构成TradingView提供或认可的金融、投资、交易或其它类型的建议或背书。请在使用条款阅读更多信息。