OPEN-SOURCE SCRIPT
已更新 RISK
## Main Purpose
The indicator calculates and displays risk levels based on margin requirements and daily settlement prices, helping traders visualize their potential risk exposure.
## Key Features
**Inputs:**
- **Margin for Calculation**: The CME long margin requirement for the asset
- **HTF Margin Line**: An anchor point for higher timeframe margin calculations
**Core Calculations:**
1. **Settlement Price Tracking**: Captures daily settlement prices during specific session times (6:58-6:59 PM ET for close, 6:00-6:01 PM ET for new day open)
2. **Risk Percentage**: Calculates `margin / (point value × settlement price)` - with special handling for Micro contracts (symbols starting with "M") that uses 10× point value
3. **Risk Intervals**: Determines price intervals representing one margin unit of risk
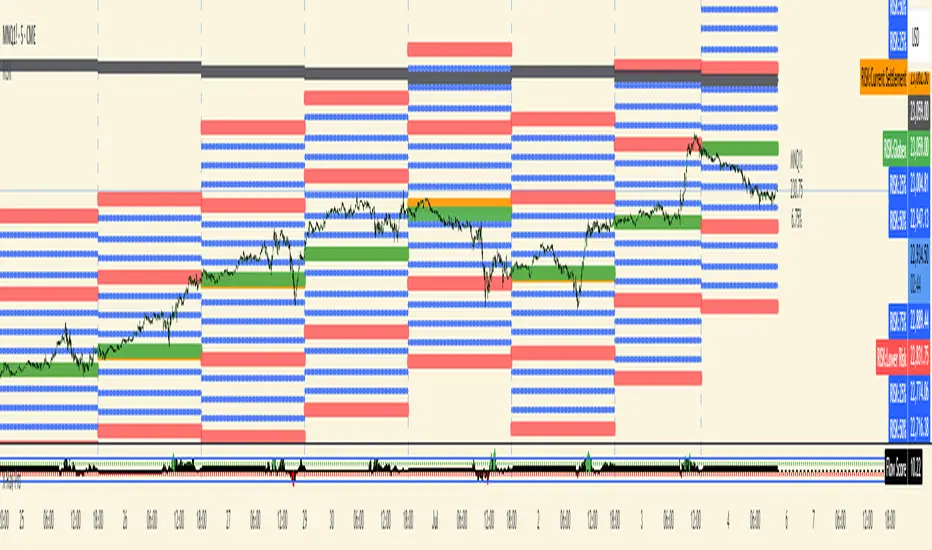
## Visual Display
The indicator plots multiple risk levels on the chart:
- **Settlement price** (orange circles)
- **Globex open** (green circles)
- **Upper/Lower Risk levels** (red circles) - one and two risk intervals away
- **Subdivision levels** (blue crosses) - 25%, 50%, and 75% of each risk interval
- **MHP+ level** (black crosses) - HTF anchor adjusted by risk percentage
- **HTF Anchor** (black crosses)
## Practical Use
This helps futures traders:
- Visualize how far price can move before hitting margin calls
- See risk levels relative to daily settlements
- Plan position sizing and risk management
- Understand exposure in terms of actual margin requirements
The indicator essentially transforms abstract margin numbers into concrete price levels on the chart, making risk management more visual and intuitive.
The indicator calculates and displays risk levels based on margin requirements and daily settlement prices, helping traders visualize their potential risk exposure.
## Key Features
**Inputs:**
- **Margin for Calculation**: The CME long margin requirement for the asset
- **HTF Margin Line**: An anchor point for higher timeframe margin calculations
**Core Calculations:**
1. **Settlement Price Tracking**: Captures daily settlement prices during specific session times (6:58-6:59 PM ET for close, 6:00-6:01 PM ET for new day open)
2. **Risk Percentage**: Calculates `margin / (point value × settlement price)` - with special handling for Micro contracts (symbols starting with "M") that uses 10× point value
3. **Risk Intervals**: Determines price intervals representing one margin unit of risk
## Visual Display
The indicator plots multiple risk levels on the chart:
- **Settlement price** (orange circles)
- **Globex open** (green circles)
- **Upper/Lower Risk levels** (red circles) - one and two risk intervals away
- **Subdivision levels** (blue crosses) - 25%, 50%, and 75% of each risk interval
- **MHP+ level** (black crosses) - HTF anchor adjusted by risk percentage
- **HTF Anchor** (black crosses)
## Practical Use
This helps futures traders:
- Visualize how far price can move before hitting margin calls
- See risk levels relative to daily settlements
- Plan position sizing and risk management
- Understand exposure in terms of actual margin requirements
The indicator essentially transforms abstract margin numbers into concrete price levels on the chart, making risk management more visual and intuitive.
版本注释
Updated to show settlement correctly regardless of chart settings开源脚本
秉承TradingView的精神,该脚本的作者将其开源,以便交易者可以查看和验证其功能。向作者致敬!您可以免费使用该脚本,但请记住,重新发布代码须遵守我们的网站规则。
免责声明
这些信息和出版物并非旨在提供,也不构成TradingView提供或认可的任何形式的财务、投资、交易或其他类型的建议或推荐。请阅读使用条款了解更多信息。
开源脚本
秉承TradingView的精神,该脚本的作者将其开源,以便交易者可以查看和验证其功能。向作者致敬!您可以免费使用该脚本,但请记住,重新发布代码须遵守我们的网站规则。
免责声明
这些信息和出版物并非旨在提供,也不构成TradingView提供或认可的任何形式的财务、投资、交易或其他类型的建议或推荐。请阅读使用条款了解更多信息。