OPEN-SOURCE SCRIPT
Cycle VTLs – with Scaled Channels
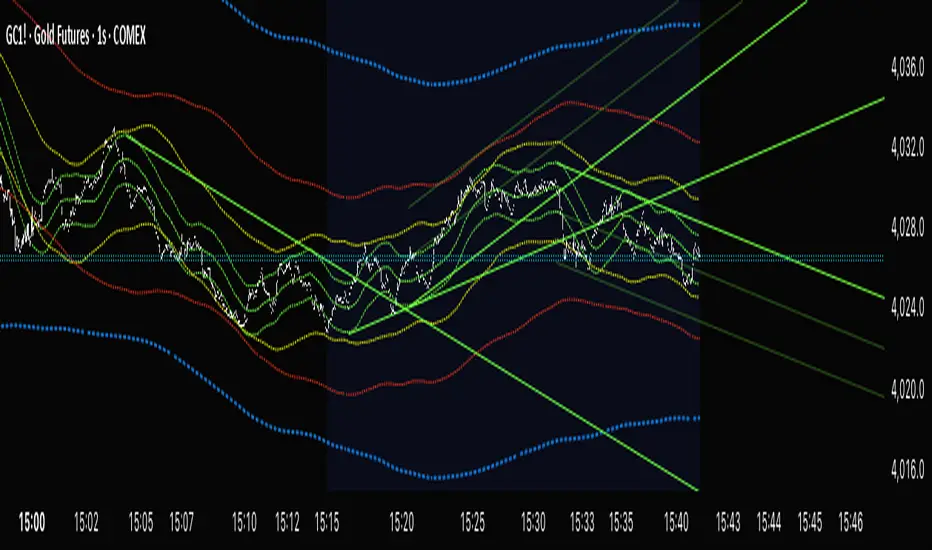
"Cycle VTLs – with Scaled Channels" for TradingView plots Valid Trend Lines (VTLs) based on Hurst's Cyclic Theory, connecting consecutive price peaks (downward VTLs) or troughs (upward VTLs) for specific cycles. It uses up to eight Simple Moving Averages (SMAs) (default lengths: 25, 50, 100, 200, 400, 800, 1600, 1600 bars) with customizable envelope bands to detect pivots and draw VTLs, enhanced by optional parallel channels scaled to envelope widths.
Key Features:
Valid Trend Lines (VTLs):
Upward VTLs: Connect consecutive cycle troughs, sloping upward.
Downward VTLs: Connect consecutive cycle peaks, sloping downward.
Hurst’s Rules:
Connects consecutive cycle peaks/troughs.
Must not cross price between points.
Downward VTLs:
No longer-cycle trough between peaks.
Invalid if slope is incorrect (upward VTL not up, downward VTL not down).
Expired VTLs: Historical VTLs (crossed by price) from up to three prior cycle waves.
SMA Cycles:
Eight customizable SMAs with envelope bands (offset × multiplier) for pivot detection.
Channels:
Optional parallel lines around VTLs, width set by channelFactor × envelope half-width.
Pivot Detection:
Fractal-based (pivotPeriod) on envelopes or price (usePriceFallback).
Customization:
Toggle cycles, VTLs, and channels.
Adjust SMA lengths, offsets, colors, line styles, and widths.
Enable centered envelopes, slope filtering, and limit stored lines (maxStoredLines).
Usage in Hurst’s Cyclic TheoryAnalysis:
VTLs identify cycle trends; upward VTLs suggest bullish momentum, downward VTLs bearish.
Price crossing below an upward VTL confirms a peak in the next longer cycle; crossing above a downward VTL confirms a trough.
Trading:
Buy: Price bounces off upward VTL or breaks above downward VTL.
Sell: Price rejects downward VTL or breaks below upward VTL.
Use channels for support/resistance, breakouts, or stop-loss/take-profit levels.
Workflow:
Add indicator on TradingView.
Enable desired cycles (e.g., 50-bar, 1600-bar), adjust pivotPeriod, channelFactor, and showOnlyCorrectSlope.
Monitor VTL crossings and channels for trade signals.
NotesOptimized for performance with line limits.
Ideal for cycle-based trend analysis across markets (stocks, forex, crypto).
Debug labels show pivot counts and VTL status.
This indicator supports Hurst’s Cyclic Theory for trend identification and trading decisions with flexible, cycle-based VTLs and channels.
Use global variable to scale to chart. best results use factors of 2 and double. try 2, 4, 8, 16...128, 256, etc until price action fits 95% in smallest cycle.
开源脚本
秉承TradingView的精神,该脚本的作者将其开源,以便交易者可以查看和验证其功能。向作者致敬!您可以免费使用该脚本,但请记住,重新发布代码须遵守我们的网站规则。
免责声明
这些信息和出版物并非旨在提供,也不构成TradingView提供或认可的任何形式的财务、投资、交易或其他类型的建议或推荐。请阅读使用条款了解更多信息。
开源脚本
秉承TradingView的精神,该脚本的作者将其开源,以便交易者可以查看和验证其功能。向作者致敬!您可以免费使用该脚本,但请记住,重新发布代码须遵守我们的网站规则。
免责声明
这些信息和出版物并非旨在提供,也不构成TradingView提供或认可的任何形式的财务、投资、交易或其他类型的建议或推荐。请阅读使用条款了解更多信息。