OPEN-SOURCE SCRIPT
Gator Tail
Gator Tail
Building on Bill William’s Alligator, the Gator Tail provides the trader with a scaled value of deviation between the market price and the rolling average. Meant to be used as a trend reversal indicator, best results when combined with the Awesome Oscillator (AO).
Script Theory Basics
This script is based off of the Bill Williams Alligator indicator. In this indicator, the variance between the ‘jaw’ and the current price represents the deviation of price from its average. Using the alligator, the trader must identify this using their eye only. This script provides a numerical value, charted in histogram format like the Awesome Oscillator. Using the two in tandem allows the trader to identify reversal points and act on positions accordingly.
Script Technicalities
The Gator Tail value is derived as follows. To preface, the ‘jaw’ is a 13 period simple moving average, plotted 8 periods into the future on the chart. A calculation is performed on the ‘jaw’ value to extract its current value less the offset. This value is compared to the current price at the time of printing the equation. Price takes the hl2 value (high + low / 2). The variance between the two values is calculated by subtracting the jaw offset from the price value, and dividing this value by the offset value ([price - jaw offset] / jaw offset). This value prints as an absolute (irrespective of positive or negative) and gets plotted on the chart for the period. The range of values is 0.00 to 1.00.
Using Gator Tail
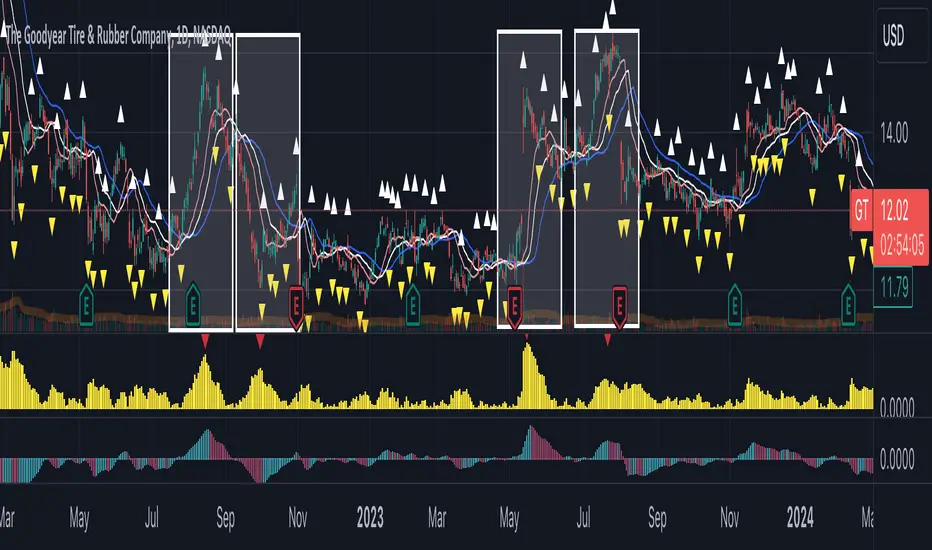
Any value above 0.20 is considered to be in the warning range. Values exceeding the 0.35-0.40 range are considered to be highly deviated. Highly deviated Gator Tail values combined with a color reversal from the AO indicate an entry/exit point in the chart. Using the two indicators on top of one another provides an easy visual cue to identify market reversal points. In the example chart above, we can see the red arrows on the Gator Tail coinciding with the AO reversals to result in the chart movements in the candlestick pane.
Limitations
This indicator does not work well with cryptocurrencies (altcoins or otherwise). The prices in these markets have few ties to macroeconomic trends or performance of an underlying asset. When testing this script, it was not found to be a reliable predictor of market reversals. This script is meant to be used with standard equities (stocks, stock options, currencies) where markets follow a reasonable level of predictability and have some underlying tie to real world events and relativity to historical prices.
Building on Bill William’s Alligator, the Gator Tail provides the trader with a scaled value of deviation between the market price and the rolling average. Meant to be used as a trend reversal indicator, best results when combined with the Awesome Oscillator (AO).
Script Theory Basics
This script is based off of the Bill Williams Alligator indicator. In this indicator, the variance between the ‘jaw’ and the current price represents the deviation of price from its average. Using the alligator, the trader must identify this using their eye only. This script provides a numerical value, charted in histogram format like the Awesome Oscillator. Using the two in tandem allows the trader to identify reversal points and act on positions accordingly.
Script Technicalities
The Gator Tail value is derived as follows. To preface, the ‘jaw’ is a 13 period simple moving average, plotted 8 periods into the future on the chart. A calculation is performed on the ‘jaw’ value to extract its current value less the offset. This value is compared to the current price at the time of printing the equation. Price takes the hl2 value (high + low / 2). The variance between the two values is calculated by subtracting the jaw offset from the price value, and dividing this value by the offset value ([price - jaw offset] / jaw offset). This value prints as an absolute (irrespective of positive or negative) and gets plotted on the chart for the period. The range of values is 0.00 to 1.00.
Using Gator Tail
Any value above 0.20 is considered to be in the warning range. Values exceeding the 0.35-0.40 range are considered to be highly deviated. Highly deviated Gator Tail values combined with a color reversal from the AO indicate an entry/exit point in the chart. Using the two indicators on top of one another provides an easy visual cue to identify market reversal points. In the example chart above, we can see the red arrows on the Gator Tail coinciding with the AO reversals to result in the chart movements in the candlestick pane.
Limitations
This indicator does not work well with cryptocurrencies (altcoins or otherwise). The prices in these markets have few ties to macroeconomic trends or performance of an underlying asset. When testing this script, it was not found to be a reliable predictor of market reversals. This script is meant to be used with standard equities (stocks, stock options, currencies) where markets follow a reasonable level of predictability and have some underlying tie to real world events and relativity to historical prices.
开源脚本
秉承TradingView的精神,该脚本的作者将其开源,以便交易者可以查看和验证其功能。向作者致敬!您可以免费使用该脚本,但请记住,重新发布代码须遵守我们的网站规则。
免责声明
这些信息和出版物并非旨在提供,也不构成TradingView提供或认可的任何形式的财务、投资、交易或其他类型的建议或推荐。请阅读使用条款了解更多信息。
免责声明
这些信息和出版物并非旨在提供,也不构成TradingView提供或认可的任何形式的财务、投资、交易或其他类型的建议或推荐。请阅读使用条款了解更多信息。