OPEN-SOURCE SCRIPT
EMAs Personalizáveis (até 5)
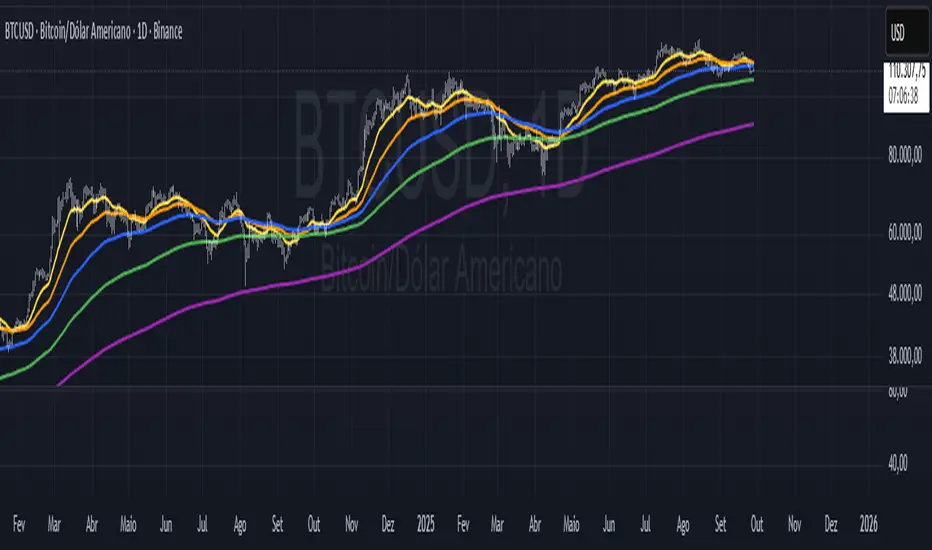
📘 Indicator Explanation – Customizable EMAs (up to 5)
This indicator was developed in Pine Script v6 to make it easier to visualize multiple Exponential Moving Averages (EMAs) on a single chart.
🔑 Main features:
Supports up to 5 different EMAs.
Ability to enable or disable each EMA individually.
Fully customizable period for each EMA.
Flexible color selection for better visual organization.
Adjustable line thickness to highlight the most relevant levels.
📌 How to use:
Open the indicator settings.
Select which EMAs you want to display (from 1 to 5).
Define the period (e.g., 20, 50, 100, 200, etc.).
Choose a color for each EMA.
Observe price behavior relative to the EMAs to identify:
Trends → price above long EMAs indicates bullish strength.
Reversals → EMA crossovers may signal a change in direction.
Dynamic support and resistance → EMAs often act as reaction zones for price.
💡 Practical example:
Short EMA (20) → shows short-term movement.
Mid-term EMA (50 or 100) → confirms trend direction.
Long EMA (200 or 500) → indicates the overall market trend.
👉 This indicator is flexible and can be used for scalping, swing trading, or position trading, depending on the chosen periods.
开源脚本
秉承TradingView的精神,该脚本的作者将其开源,以便交易者可以查看和验证其功能。向作者致敬!您可以免费使用该脚本,但请记住,重新发布代码须遵守我们的网站规则。
免责声明
这些信息和出版物并非旨在提供,也不构成TradingView提供或认可的任何形式的财务、投资、交易或其他类型的建议或推荐。请阅读使用条款了解更多信息。
免责声明
这些信息和出版物并非旨在提供,也不构成TradingView提供或认可的任何形式的财务、投资、交易或其他类型的建议或推荐。请阅读使用条款了解更多信息。