PROTECTED SOURCE SCRIPT
Electricity Futures x DAM Window Tracking
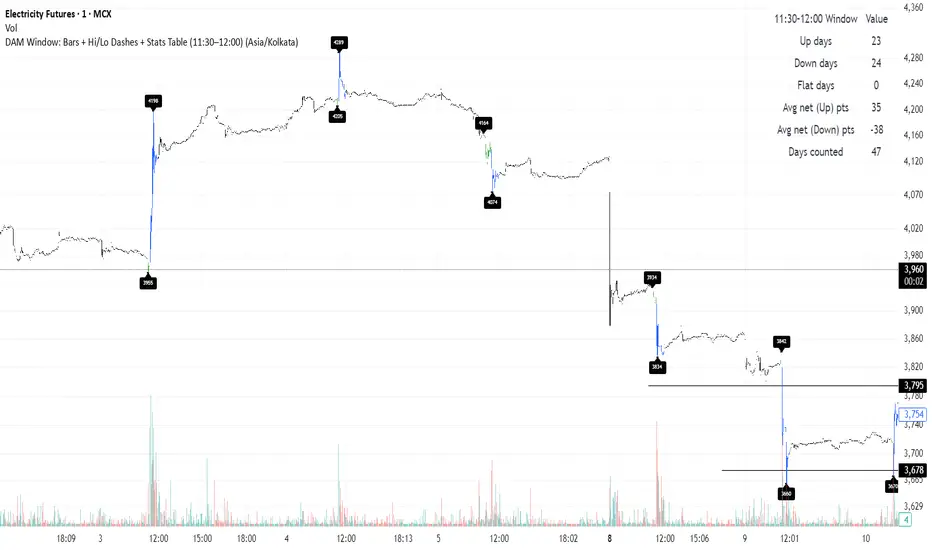
What this one script does
Tracks the OHLC during 11:30–12:00 window per day
Colors bars
11:30–11:45 → Green
11:45–12:00 → Blue
Draws
A horizontal dash at the High and at the Low along with price labels.
Displays a table
Up days - count of days when prices went up post event
Down days - count of days when prices went down post event
Flat days
Avg net change (points) on up days - average of net change on up days
Avg net change (points) on down days - average of net change on down days
Works on 1m / 5m / 15m charts only.
受保护脚本
此脚本以闭源形式发布。 但是,您可以自由使用,没有任何限制 — 了解更多信息这里。
免责声明
这些信息和出版物并非旨在提供,也不构成TradingView提供或认可的任何形式的财务、投资、交易或其他类型的建议或推荐。请阅读使用条款了解更多信息。
受保护脚本
此脚本以闭源形式发布。 但是,您可以自由使用,没有任何限制 — 了解更多信息这里。
免责声明
这些信息和出版物并非旨在提供,也不构成TradingView提供或认可的任何形式的财务、投资、交易或其他类型的建议或推荐。请阅读使用条款了解更多信息。