OPEN-SOURCE SCRIPT
已更新 High Volume Candles by Time Period
Description:
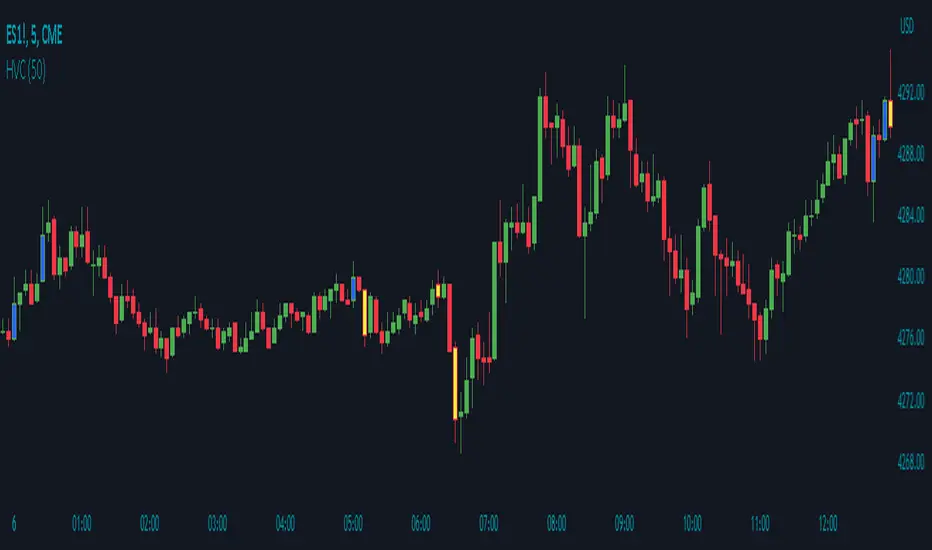
The High Volume Candles indicator (HVC) is a technical analysis tool designed to identify candles with high trading volume. It allows traders to quickly spot periods of significant market activity based on volume.
How it Works:
The HVC indicator analyzes the volume of each candle in relation to the highest volume observed over a specified lookback period. The indicator compares the current volume with the highest volume within the defined lookback period and identifies candles that have volume equal to or greater than this threshold. It then distinguishes between bullish and bearish candles and assigns custom colors to highlight these high volume occurrences.
Usage:
To effectively utilize the High Volume Candles indicator, follow these steps:
1. Apply the HVC indicator to your chart by adding it from the available indicators.
2. Customize the lookback period according to your trading preferences. This parameter determines the number of previous candles to consider when calculating the highest volume.
3. Observe the candles on the chart:
- Bullish candles (blue by default) indicate periods of high volume when the closing price is higher than the opening price.
- Bearish candles (yellow by default) indicate periods of high volume when the closing price is lower than the opening price.
4. Pay attention to the color-coded volume indications within the candles, which highlight periods of high trading activity.
5. Analyze the volume patterns in conjunction with price action to identify potential trading opportunities. High volume candles often indicate increased market participation and can suggest significant price moves or reversals.
6. Combine the analysis of high volume candles with other technical analysis tools, such as trend lines, support and resistance levels, or indicators, to confirm potential trade setups.
7. Implement appropriate risk management strategies, including setting stop-loss orders and position sizing, to manage your trades effectively and protect your capital.
版本注释
Alerts have been added to the script. Check settings.版本注释
Updates:1. The default lookback period has been adjusted to 50.
2. Update to indicator image.
开源脚本
秉承TradingView的精神,该脚本的作者将其开源,以便交易者可以查看和验证其功能。向作者致敬!您可以免费使用该脚本,但请记住,重新发布代码须遵守我们的网站规则。
免责声明
这些信息和出版物并非旨在提供,也不构成TradingView提供或认可的任何形式的财务、投资、交易或其他类型的建议或推荐。请阅读使用条款了解更多信息。
开源脚本
秉承TradingView的精神,该脚本的作者将其开源,以便交易者可以查看和验证其功能。向作者致敬!您可以免费使用该脚本,但请记住,重新发布代码须遵守我们的网站规则。
免责声明
这些信息和出版物并非旨在提供,也不构成TradingView提供或认可的任何形式的财务、投资、交易或其他类型的建议或推荐。请阅读使用条款了解更多信息。