INVITE-ONLY SCRIPT
OrderBlocks [SignalCave]

The OrderBlocks indicator is used to find the supply and demand zones that represent the support and resistance.
What it is Demand Zone?
A demand zone is the price area at which the traders usually buy. This area is present below the current price, where the highest buying interest or potential. This means the demand zone has many buyers available due to many buying orders at that level. When the price hits this level, the unfilled orders get completed and bring up the price.
What it is Supply Zone?
A supply zone is the price area at which the traders usually sell. This area is present above the current price, where the highest selling interest or potential. When the price hits this level, the unfilled orders get completed and bring down the price.
OrderBlocks [SignalCave] Indicator
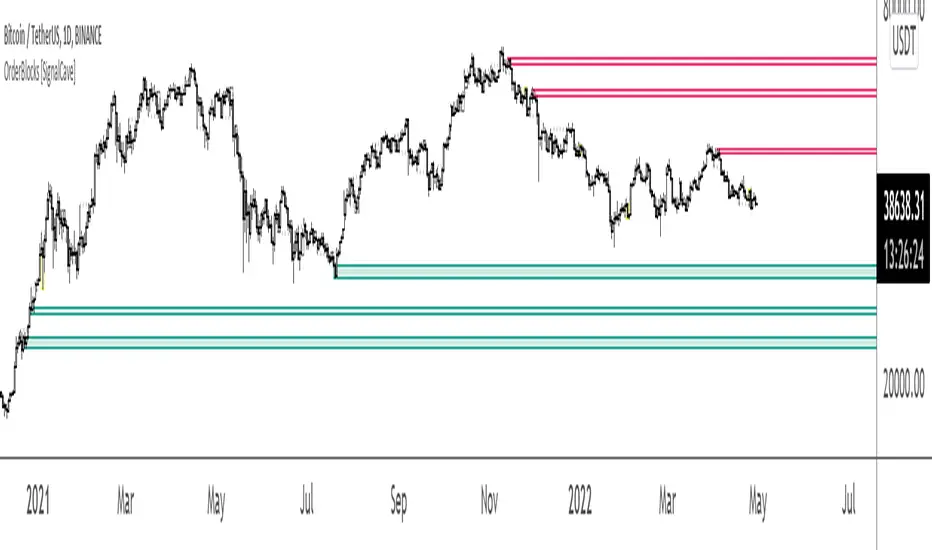
OrderBlocks indicator have four main visual output which are active demand zones (green), active supply zones (red), tested zones (yellow) and inactive zones (black).
Active Zones: Once the market structure breakout or breakdown, indicator draws a new zone (green or red). When the price enters in the active zone at the first time, price tends to bounce over it.
Tested Zones: If price touches the active zone but did not close any bar over or below it, indicator marks the tested zone as a yellow color. If the price touches multiple times, zone get weaker and tend to break when the price enters same zone once again.
Inactive Zones: If bar close over or below any active zone then indicator marks it as a black color and it turns an inactive zone afterwards. Inactive zones have less effective price turning points compare to active and tested zones.
仅限邀请脚本
只有作者授权的用户才能访问此脚本。您需要申请并获得使用许可。通常情况下,付款后即可获得许可。更多详情,请按照下方作者的说明操作,或直接联系kriswaters。
TradingView不建议您付费购买或使用任何脚本,除非您完全信任其作者并了解其工作原理。您也可以在我们的社区脚本找到免费的开源替代方案。
作者的说明
You can apply access request with filling the Google form. https://bit.ly/SignalCaveAccess
Pine Script Code Generator:
getpinescript.com/
Optimize Your TradingView Strategies:
pinetune.app
Trading Simulation Game:
Dare2Trade.com
Pine Script Job Proposals:
t.me/kriswaters
getpinescript.com/
Optimize Your TradingView Strategies:
pinetune.app
Trading Simulation Game:
Dare2Trade.com
Pine Script Job Proposals:
t.me/kriswaters
免责声明
这些信息和出版物并非旨在提供,也不构成TradingView提供或认可的任何形式的财务、投资、交易或其他类型的建议或推荐。请阅读使用条款了解更多信息。