OPEN-SOURCE SCRIPT
EU & US Open Signals (Triple Confirmation)
🚀 EU & US Open Signals: Triple Confirmation Breakouts
💡 What This Indicator Does
This indicator plots the opening prices of the European (EU) and American (US) trading sessions as key daily support/resistance levels. Its main function is to generate three distinct levels of signals based on the breakout of these levels, strictly filtered by candlestick type.
The goal is to easily spot market momentum following the opening of the major trading sessions.
🔑 Key Features
1. Daily Session Levels
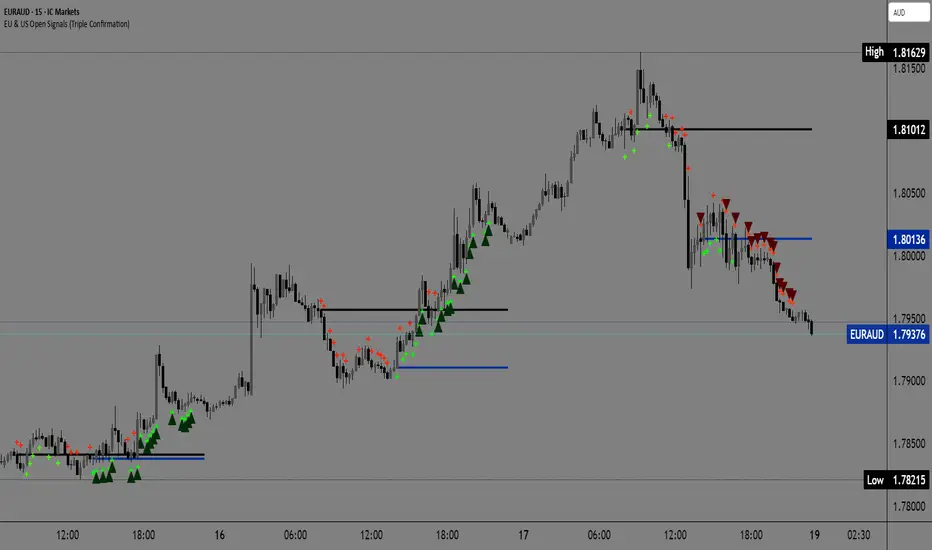
The indicator plots two crucial horizontal lines that reset daily:
EU Open (Black Line): The European session opening price (Default: 06:00 UTC).
US Open (Dark Blue Line): The American session opening price (Default: 12:00 UTC).
2. Triple Signaling Logic
All signals are only generated if the breakout candle is bullish (for Buy) or bearish (for Sell), and only within your set trading hours.
Logic I. EU Single Break
Condition: Close breaks above/below the EU Open Level + Bullish/Bearish candle.
Visual Plot: Small Cross (Green for Buy / Red for Sell).
Meaning: Early signal focused on EU session momentum.
Logic II. US Single Break
Condition: Close breaks above/below the US Open Level + Bullish/Bearish candle.
Visual Plot: Small Cross (Green for Buy / Red for Sell).
Meaning: Signal focused on US session momentum.
Logic III. Double Break (HIGH CONFIRMATION)
Condition: Close breaks above Both Levels (EU and US) for Buy, or below Both Levels for Sell + Bullish/Bearish candle.
Visual Plot: Large Triangle (Dark Green/Red).
⚠️ Crucial: This is the strongest signal, indicating strong momentum as both key daily levels have been broken.
⚙️ Simple Settings
Easily customize the indicator to fit your strategy:
EU/US Session Open Hour (UTC): Set the exact session open times.
Time Zone: Select your time zone for accurate level calculation.
Start/End Trading Hour: Define the daily window for when signals will be active.
🎯 Recommended Use
High Confidence: Focus on the Double Break (Logic III) - Large Triangle for your most confirmed entries.
Context: Use the Single Break signals (I and II) to confirm early market bias.
Risk: The Open Levels can serve as natural points for setting Stop-Loss orders.
Disclaimer: Trading carries risk. This tool is for analysis purposes only. Use it at your own discretion.
💡 What This Indicator Does
This indicator plots the opening prices of the European (EU) and American (US) trading sessions as key daily support/resistance levels. Its main function is to generate three distinct levels of signals based on the breakout of these levels, strictly filtered by candlestick type.
The goal is to easily spot market momentum following the opening of the major trading sessions.
🔑 Key Features
1. Daily Session Levels
The indicator plots two crucial horizontal lines that reset daily:
EU Open (Black Line): The European session opening price (Default: 06:00 UTC).
US Open (Dark Blue Line): The American session opening price (Default: 12:00 UTC).
2. Triple Signaling Logic
All signals are only generated if the breakout candle is bullish (for Buy) or bearish (for Sell), and only within your set trading hours.
Logic I. EU Single Break
Condition: Close breaks above/below the EU Open Level + Bullish/Bearish candle.
Visual Plot: Small Cross (Green for Buy / Red for Sell).
Meaning: Early signal focused on EU session momentum.
Logic II. US Single Break
Condition: Close breaks above/below the US Open Level + Bullish/Bearish candle.
Visual Plot: Small Cross (Green for Buy / Red for Sell).
Meaning: Signal focused on US session momentum.
Logic III. Double Break (HIGH CONFIRMATION)
Condition: Close breaks above Both Levels (EU and US) for Buy, or below Both Levels for Sell + Bullish/Bearish candle.
Visual Plot: Large Triangle (Dark Green/Red).
⚠️ Crucial: This is the strongest signal, indicating strong momentum as both key daily levels have been broken.
⚙️ Simple Settings
Easily customize the indicator to fit your strategy:
EU/US Session Open Hour (UTC): Set the exact session open times.
Time Zone: Select your time zone for accurate level calculation.
Start/End Trading Hour: Define the daily window for when signals will be active.
🎯 Recommended Use
High Confidence: Focus on the Double Break (Logic III) - Large Triangle for your most confirmed entries.
Context: Use the Single Break signals (I and II) to confirm early market bias.
Risk: The Open Levels can serve as natural points for setting Stop-Loss orders.
Disclaimer: Trading carries risk. This tool is for analysis purposes only. Use it at your own discretion.
开源脚本
秉承TradingView的精神,该脚本的作者将其开源,以便交易者可以查看和验证其功能。向作者致敬!您可以免费使用该脚本,但请记住,重新发布代码须遵守我们的网站规则。
Free telegram channel t.me/alexmasterforex
免责声明
这些信息和出版物并非旨在提供,也不构成TradingView提供或认可的任何形式的财务、投资、交易或其他类型的建议或推荐。请阅读使用条款了解更多信息。
开源脚本
秉承TradingView的精神,该脚本的作者将其开源,以便交易者可以查看和验证其功能。向作者致敬!您可以免费使用该脚本,但请记住,重新发布代码须遵守我们的网站规则。
Free telegram channel t.me/alexmasterforex
免责声明
这些信息和出版物并非旨在提供,也不构成TradingView提供或认可的任何形式的财务、投资、交易或其他类型的建议或推荐。请阅读使用条款了解更多信息。