OPEN-SOURCE SCRIPT
Moving Averages Trend Indicator
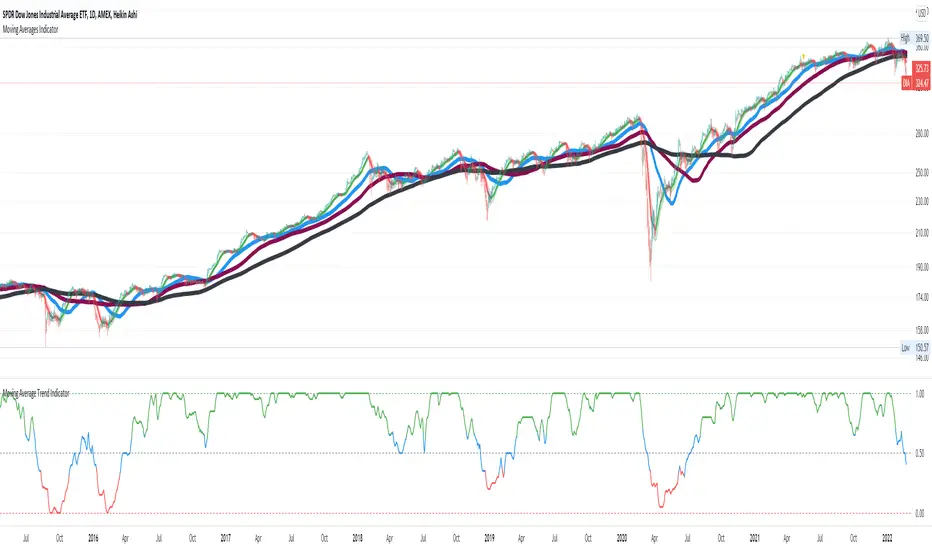
Computes a metric (0.0-1.0) based on the relative (above/below) relationship of price (close) and the moving averages of WMA0 (20day), SMA1 (50day), SMA2 (100day), SMA3 (200day).
Metric = 1.0 when price > SMA0 > SMA1 > SMA2 > SMA3
Metric = 0.0 when price < SMA0 < SMA1 < SMA2 < SMA3
This metric helps you track the price "trend." Color of the metric helps you track if the price is a bullish (green) or bearish (red). Blue indicates neutral.
Settings:
- Time Frame is adjustable
- SMA lengths are adjustable
- Threshold for bullish/bearish is adjustable
开源脚本
秉承TradingView的精神,该脚本的作者将其开源,以便交易者可以查看和验证其功能。向作者致敬!您可以免费使用该脚本,但请记住,重新发布代码须遵守我们的网站规则。
免责声明
这些信息和出版物并非旨在提供,也不构成TradingView提供或认可的任何形式的财务、投资、交易或其他类型的建议或推荐。请阅读使用条款了解更多信息。
免责声明
这些信息和出版物并非旨在提供,也不构成TradingView提供或认可的任何形式的财务、投资、交易或其他类型的建议或推荐。请阅读使用条款了解更多信息。