OPEN-SOURCE SCRIPT
Shifted Symbol Overlay with Offset
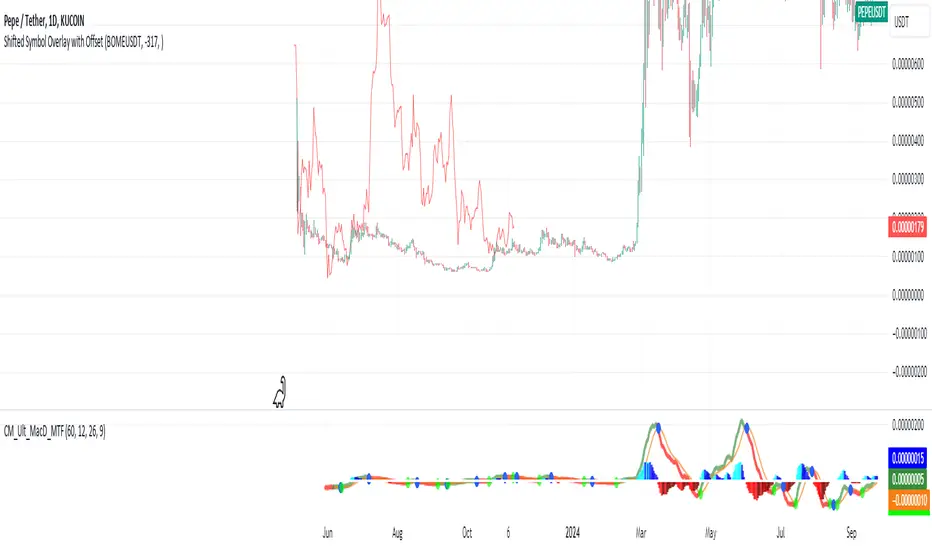
The Shifted Symbol Overlay Indicator is a custom TradingView indicator designed to overlay the price data of one stock or asset over another, allowing for direct visual comparison. This is particularly useful for comparing the performance of two assets over different time periods. The indicator enables you to shift the data from one asset either forward or backward in time, making it easier to compare historical data from one stock with more recent data from another. The indicator supports shifting both to the right (future periods) and to the left (earlier periods), helping traders and analysts explore correlations or divergences between two financial instruments.
The indicator also includes a normalization option that adjusts the scale of the two assets, so you can compare them even if they have vastly different price levels. This is useful when you're interested in relative performance rather than the absolute price values.
The indicator also includes a normalization option that adjusts the scale of the two assets, so you can compare them even if they have vastly different price levels. This is useful when you're interested in relative performance rather than the absolute price values.
开源脚本
秉承TradingView的精神,该脚本的作者将其开源,以便交易者可以查看和验证其功能。向作者致敬!您可以免费使用该脚本,但请记住,重新发布代码须遵守我们的网站规则。
免责声明
这些信息和出版物并非旨在提供,也不构成TradingView提供或认可的任何形式的财务、投资、交易或其他类型的建议或推荐。请阅读使用条款了解更多信息。
免责声明
这些信息和出版物并非旨在提供,也不构成TradingView提供或认可的任何形式的财务、投资、交易或其他类型的建议或推荐。请阅读使用条款了解更多信息。