PROTECTED SOURCE SCRIPT
Gaps % Size Distribution
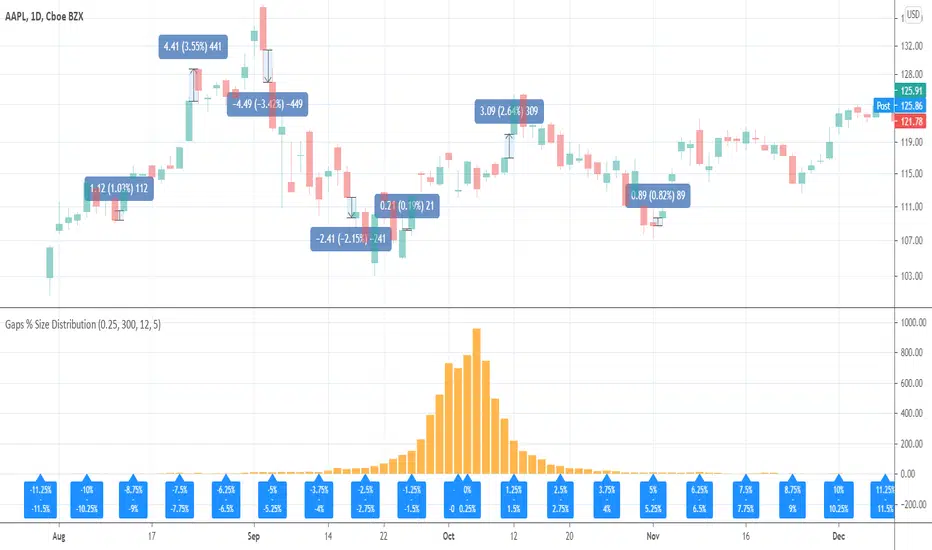
This tool is to visualize the distribution of gap % sizes, i.e. those things that I marked on the main chart. The tool uses the entire history of an instrument.
The detalization depends on the Binning Step parameter. The lower chart timeframe the lower that step should be.
Good luck.
The detalization depends on the Binning Step parameter. The lower chart timeframe the lower that step should be.
Good luck.
受保护脚本
此脚本以闭源形式发布。 但是,您可以自由使用,没有任何限制 — 了解更多信息这里。
👨🏻💻 Coding services -> Telegram: @alex_everget
🆓 List of my FREE indicators: bit.ly/2S7EPuN
💰 List of my PREMIUM indicators: bit.ly/33MA81f
Join Bybit and get up to $6,045 in bonuses!
bybit.com/invite?ref=56ZLQ0Z
🆓 List of my FREE indicators: bit.ly/2S7EPuN
💰 List of my PREMIUM indicators: bit.ly/33MA81f
Join Bybit and get up to $6,045 in bonuses!
bybit.com/invite?ref=56ZLQ0Z
免责声明
这些信息和出版物并非旨在提供,也不构成TradingView提供或认可的任何形式的财务、投资、交易或其他类型的建议或推荐。请阅读使用条款了解更多信息。