OPEN-SOURCE SCRIPT
Dynamic Trend Lines-AYNET
Code Summary: Dynamic Trend Lines
This code dynamically draws trend lines and labels based on swing highs and lows identified from historical price action.
Key Features
Swing Point Detection:
Uses the ta.pivothigh and ta.pivotlow functions to identify recent swing highs and swing lows based on a customizable lookback period.
Trend Lines:
Uptrend Line:
Draws a line connecting swing low points.
Colored in blue by default.
Downtrend Line:
Draws a line connecting swing high points.
Colored in red by default.
Lines dynamically adjust as new swing points are identified.
Labels:
Adds a circle-style label at each swing high and swing low.
Displays the price value of the swing point.
Labels have:
Green background for uptrends.
Red background for downtrends.
Customizable Inputs:
lookback: Sensitivity of swing point detection (higher value = fewer swings).
line_color_up and line_color_down: Colors for the trend lines.
label_bg_up and label_bg_down: Colors for the label backgrounds.
Auto Updates:
Trend lines and labels update dynamically as the chart progresses, ensuring they reflect the latest market conditions.
How It Works
Identify Swing Points:
Detects local highs and lows within the defined lookback period.
Draw Lines:
Uptrend lines are drawn from the most recent swing lows.
Downtrend lines are drawn from the most recent swing highs.
Add Labels:
Each swing point is labeled with its price value for easy reference.
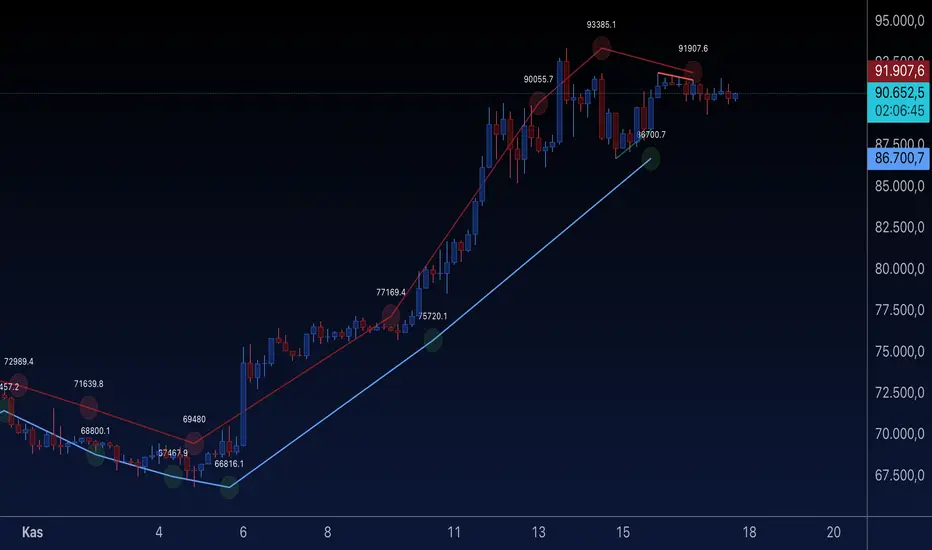
Visual Output
Trend Lines:
Blue for uptrends, red for downtrends.
Labels:
Circular labels with price values:
Green for swing lows (uptrend points).
Red for swing highs (downtrend points).
Example Use Case
This script is useful for traders who want to:
Visually identify key trend lines based on swing highs and lows.
Understand the critical price points of market reversals.
Use labeled price points for informed trade decisions.
Let me know if you'd like any specific refinements! 😊
This code dynamically draws trend lines and labels based on swing highs and lows identified from historical price action.
Key Features
Swing Point Detection:
Uses the ta.pivothigh and ta.pivotlow functions to identify recent swing highs and swing lows based on a customizable lookback period.
Trend Lines:
Uptrend Line:
Draws a line connecting swing low points.
Colored in blue by default.
Downtrend Line:
Draws a line connecting swing high points.
Colored in red by default.
Lines dynamically adjust as new swing points are identified.
Labels:
Adds a circle-style label at each swing high and swing low.
Displays the price value of the swing point.
Labels have:
Green background for uptrends.
Red background for downtrends.
Customizable Inputs:
lookback: Sensitivity of swing point detection (higher value = fewer swings).
line_color_up and line_color_down: Colors for the trend lines.
label_bg_up and label_bg_down: Colors for the label backgrounds.
Auto Updates:
Trend lines and labels update dynamically as the chart progresses, ensuring they reflect the latest market conditions.
How It Works
Identify Swing Points:
Detects local highs and lows within the defined lookback period.
Draw Lines:
Uptrend lines are drawn from the most recent swing lows.
Downtrend lines are drawn from the most recent swing highs.
Add Labels:
Each swing point is labeled with its price value for easy reference.
Visual Output
Trend Lines:
Blue for uptrends, red for downtrends.
Labels:
Circular labels with price values:
Green for swing lows (uptrend points).
Red for swing highs (downtrend points).
Example Use Case
This script is useful for traders who want to:
Visually identify key trend lines based on swing highs and lows.
Understand the critical price points of market reversals.
Use labeled price points for informed trade decisions.
Let me know if you'd like any specific refinements! 😊
开源脚本
秉承TradingView的精神,该脚本的作者将其开源,以便交易者可以查看和验证其功能。向作者致敬!您可以免费使用该脚本,但请记住,重新发布代码须遵守我们的网站规则。
免责声明
这些信息和出版物并非旨在提供,也不构成TradingView提供或认可的任何形式的财务、投资、交易或其他类型的建议或推荐。请阅读使用条款了解更多信息。
开源脚本
秉承TradingView的精神,该脚本的作者将其开源,以便交易者可以查看和验证其功能。向作者致敬!您可以免费使用该脚本,但请记住,重新发布代码须遵守我们的网站规则。
免责声明
这些信息和出版物并非旨在提供,也不构成TradingView提供或认可的任何形式的财务、投资、交易或其他类型的建议或推荐。请阅读使用条款了解更多信息。