OPEN-SOURCE SCRIPT
已更新 [blackcat] L1 Python Friendly Lucid SAR
Level 1
Background
LUCID SAR is an interesting technical indicator. I'm having trouble converting this to Python code. So a "Python friendly" version was rewritten literally. Because some basic functions and structures have been replaced. The performance can be 100% consistent with LUCID SAR.
Function
Mr. Bowman wrote this script after having listened to Hyperwave with Sawcruhteez and Tyler Jenks of Lucid Mr. Bowmannvestments Strategies LLC on July 3, 2019. They felt that the existing built-in Parabolic SAR indicator was not doing its calculations properly, and they hoped that someone might help them correct this. So Mr. Bowman tried his hand at it,adding the rule regarding the SAR not advancing beyond the high (low) of the prior two candles during an uptrend (downtrend), but the core script is as it was.
https://cn.tradingview.com/script/OkACQQgL-Lucid-SAR/
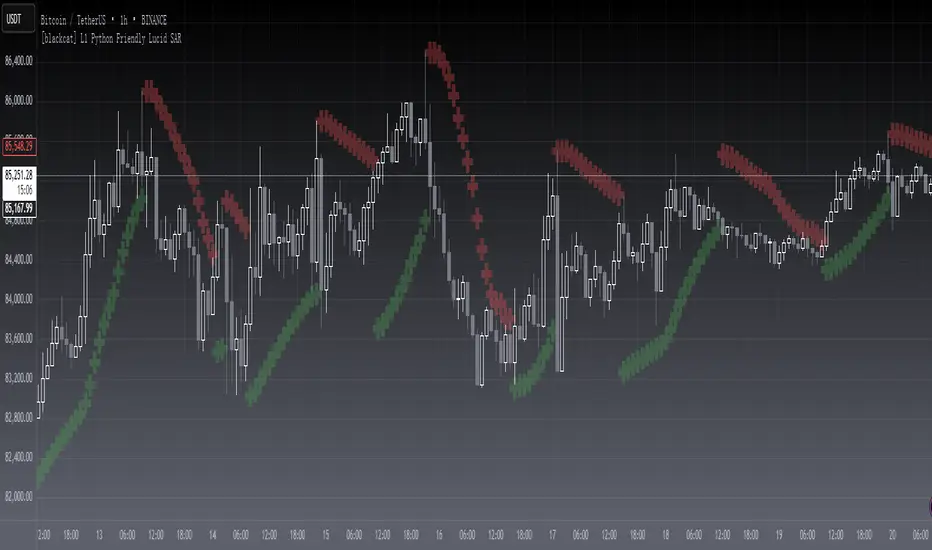
I use large sized cross with red color for downtrend, with green color for uptrend, so that when I overlapped original work from Mr. Bowman, they can be 100% matched, which provided a validation process for this re-writing work. Enjoy!
Remarks
Feedbacks are appreciated.
Python version Lucid SAR performance discussion is desired.
Background
LUCID SAR is an interesting technical indicator. I'm having trouble converting this to Python code. So a "Python friendly" version was rewritten literally. Because some basic functions and structures have been replaced. The performance can be 100% consistent with LUCID SAR.
Function
Mr. Bowman wrote this script after having listened to Hyperwave with Sawcruhteez and Tyler Jenks of Lucid Mr. Bowmannvestments Strategies LLC on July 3, 2019. They felt that the existing built-in Parabolic SAR indicator was not doing its calculations properly, and they hoped that someone might help them correct this. So Mr. Bowman tried his hand at it,adding the rule regarding the SAR not advancing beyond the high (low) of the prior two candles during an uptrend (downtrend), but the core script is as it was.
https://cn.tradingview.com/script/OkACQQgL-Lucid-SAR/
I use large sized cross with red color for downtrend, with green color for uptrend, so that when I overlapped original work from Mr. Bowman, they can be 100% matched, which provided a validation process for this re-writing work. Enjoy!
Remarks
Feedbacks are appreciated.
Python version Lucid SAR performance discussion is desired.
版本注释
OVERVIEWThe [blackcat] L1 Python Friendly Lucid SAR is an enhanced version of the traditional Stop-and-Reverse (SAR) indicator designed to be more intuitive and user-friendly. This script calculates the SAR values using a custom algorithm inspired by Python's lucidity, providing traders with clear buy and sell signals based on price action. The indicator plots these points directly on the chart, making it easy to visualize potential trend reversals 📉↗️.
FEATURES
Calculates Stop-and-Reverse (SAR) points using a custom algorithm:
Initial Acceleration Factor (AF_initial): Starting value for acceleration factor.
Increment: Value added to the acceleration factor after each new extreme point.
Maximum Acceleration Factor (AF_maximum): Maximum allowed value for the acceleration factor.
Plots SAR points on the chart with distinct colors:
Green dots indicate bullish trends.
Red dots indicate bearish trends.
Provides clear visual cues for trend changes and potential reversal points 🎯
HOW TO USE
Add the indicator to your TradingView chart by selecting it from the indicators list.
Adjust the AF_initial, AF_increment, and AF_maximum parameters as needed to fine-tune the sensitivity of the indicator ⚙️.
Observe the plotted SAR points on the chart to identify potential trend reversals.
Use the green and red dots as signals for buying and selling, respectively.
LIMITATIONS
The indicator may generate false signals in highly volatile or ranging markets 🌪️.
Users should combine this indicator with other forms of analysis for more reliable trading decisions.
The effectiveness of the indicator may vary depending on the asset and timeframe being analyzed.
NOTES
Ensure that you have sufficient historical data available for accurate calculations.
Test the indicator thoroughly on demo accounts before applying it to live trading 🔍.
Customize the appearance and parameters as needed to fit your trading strategy.
开源脚本
秉承TradingView的精神,该脚本的作者将其开源,以便交易者可以查看和验证其功能。向作者致敬!您可以免费使用该脚本,但请记住,重新发布代码须遵守我们的网站规则。
Avoid losing contact!Don't miss out! The first and most important thing to do is to join my Discord chat now! Click here to start your adventure: discord.com/invite/ZTGpQJq 防止失联,请立即行动,加入本猫聊天群: discord.com/invite/ZTGpQJq
免责声明
这些信息和出版物并非旨在提供,也不构成TradingView提供或认可的任何形式的财务、投资、交易或其他类型的建议或推荐。请阅读使用条款了解更多信息。