INVITE-ONLY SCRIPT
MOM Buy/Sell + MACD Histogram Signal Table
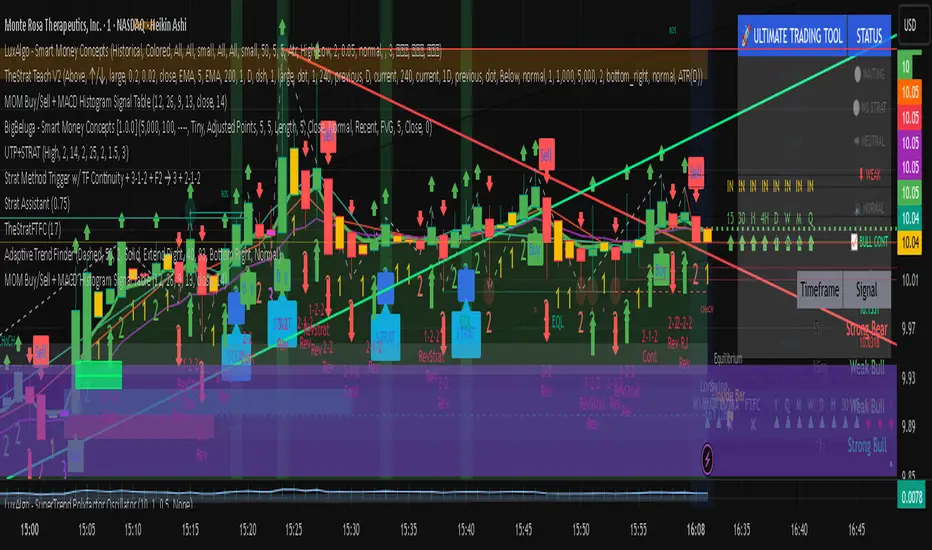
eatures:
Combined Signal Analysis - Shows when both indicators align for STRONG BUY or STRONG SELL signals
Sortable Columns - Click any column header to sort by that metric
Filter Buttons - Quickly filter to see only Strong Buy, Strong Sell, or all signals
Color-Coded Values - Green for bullish, red for bearish, gray for neutral
Visual Icons - Trending arrows for easy signal recognition
仅限邀请脚本
只有经作者批准的用户才能访问此脚本。您需要申请并获得使用权限。该权限通常在付款后授予。如需了解更多详情,请按照以下作者的说明操作,或直接联系jmslimus。
除非您完全信任其作者并了解脚本的工作原理,否則TradingView不建议您付费或使用脚本。您还可以在我们的社区脚本中找到免费的开源替代方案。
作者的说明
eatures:
Combined Signal Analysis - Shows when both indicators align for STRONG BUY or STRONG SELL signals
Sortable Columns - Click any column header to sort by that metric
Filter Buttons - Quickly filter to see only Strong Buy, Strong Sell, or all signa
免责声明
这些信息和出版物并不意味着也不构成TradingView提供或认可的金融、投资、交易或其它类型的建议或背书。请在使用条款阅读更多信息。