OPEN-SOURCE SCRIPT
Thirdeyechart Gold – Masterclass Final
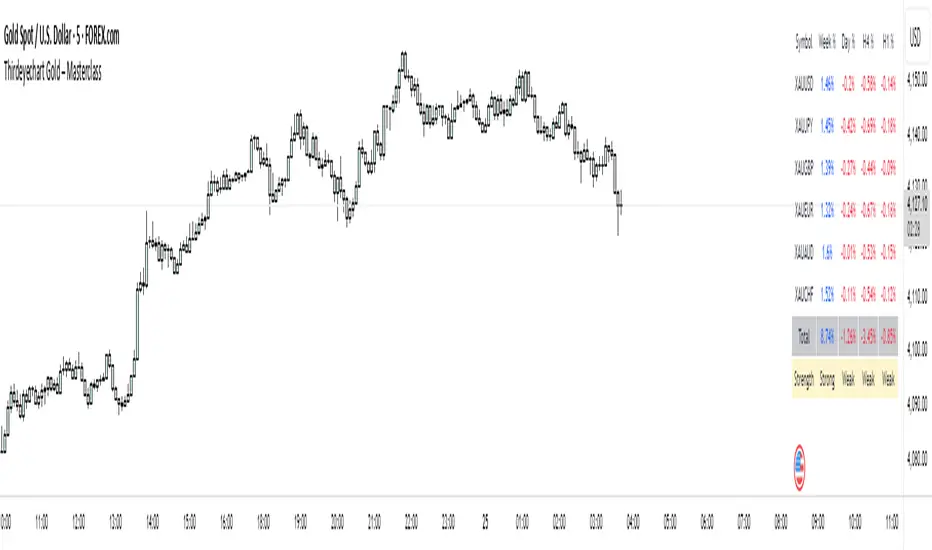
The XAU Masterclass — Final Fix is the definitive TradingView indicator for serious gold traders. Built for speed and clarity, this edition combines a solid boxed layout with an advanced math logic core to detect trend strength quickly across multiple timeframes. Designed specifically for XAU and XAU-related pairs, the indicator shows percentage change on Weekly (W), Daily (D), 4H (H4), and 1H (H1), and distills those readings into a single Total Average Strength value for instant decision context.
Visuals are clean and compact — every symbol row sits inside a solid box so chart clutter is minimised and strength/direction read at a glance. Positive movements are highlighted in blue, negative in red. The Total Average is presented alongside the timeframe values and an interpreted label: “Strong Uptrend”, “Weak Uptrend”, “Neutral”, “Weak Downtrend”, “Strong Downtrend” — driven by configurable thresholds so you can tune sensitivity to your trading style.
Math logic (how it’s calculated):
Per timeframe percent change:
pct_tf = ((close_tf - open_tf) / open_tf) * 100
(calculated for W, D, H4, H1)
Normalize timeframes by simply using their signed percent changes (no external data):
values = [pct_W, pct_D, pct_H4, pct_H1]
Total Average Strength (arithmetic mean):
Total_Avg = sum(values) / 4
Strength interpretation (default thresholds — adjustable):
Total_Avg >= +0.50 -> Strong Uptrend
+0.15 <= Total_Avg < +0.50 -> Weak Uptrend
-0.15 < Total_Avg < +0.15 -> Neutral
-0.50 < Total_Avg <= -0.15 -> Weak Downtrend
Total_Avg <= -0.50 -> Strong Downtrend
This approach keeps the computation transparent and fast while giving a consolidated market-strength readout. Traders can change thresholds or weighting if preferred; the default provides a reliable, conservative filter for most setups.
Usage note: This tool is informational and made for analysis — it does not issue buy/sell signals. Always combine with your own strategy and risk management.
Disclaimer / Copyright:
© 2025 Thirdeyechart. All rights reserved. Redistribution, copying, or commercial use without permission is prohibited. The author is not responsible for any trading losses or financial decisions made using this indicator.
开源脚本
秉承TradingView的精神,该脚本的作者将其开源,以便交易者可以查看和验证其功能。向作者致敬!您可以免费使用该脚本,但请记住,重新发布代码须遵守我们的网站规则。
免责声明
这些信息和出版物并非旨在提供,也不构成TradingView提供或认可的任何形式的财务、投资、交易或其他类型的建议或推荐。请阅读使用条款了解更多信息。
开源脚本
秉承TradingView的精神,该脚本的作者将其开源,以便交易者可以查看和验证其功能。向作者致敬!您可以免费使用该脚本,但请记住,重新发布代码须遵守我们的网站规则。
免责声明
这些信息和出版物并非旨在提供,也不构成TradingView提供或认可的任何形式的财务、投资、交易或其他类型的建议或推荐。请阅读使用条款了解更多信息。