INVITE-ONLY SCRIPT
已更新 Profit Accumulator Relative Volatility
Relative Volatility Indicator
This is a support indicator to the Main Indicator which has also been published.
This indicator uses volatility to determine if the market is quiet, or trading sideways or if there is money in the market and the opportunity for a long or short signal. There is an adjustable bottom line (in this case 0.15) and anything near or below that would indicate that no trades should be taking place. Similarly, if the trend line is declining, this is another indication that any trades should not be taken.
The trend line as an adjustable maximum setting of 0.5 and an increasing trend line is indicative of volatility in the market and a long or short position should be considered. This indicator should be used with the other suite of indicators to provide confluence of the trade.
Whilst an actual alert function is not set for the indicator, the TradingView alert function can be used to trigger a message when the line crosses above 0.15.
I've been using this successfully on the one hour FX charts, but seems to work equally as well on higher or lower time frames (not less than 15min).
The other indicators which are part of the suite are shown on the website which is highlighted in my signature at the bottom of the page. Purchase of the main indicator gives access to the full suite of eight indicators. I use the other indicators to confirm the direction of the trade and to determine if I want to trade or not. I use it along with the 2min, 15min and 4hr timeframes to identify the best entry window and how long I'm likely to be in the trade.
Support can be provided via private message or in the comments below.
The links are provided below for access to the indicator.
版本注释
Simple moving average added to provide smoothing signal to the trend line. Smoothing length can be configured in the settings of the indicator.版本注释
Updated to comply with Pinescript House Rules. 版本注释
Changed the maximum/upper volatility filter so that it captures all currency pairs. The lower volatility filter may need adjusting for each currency pair.版本注释
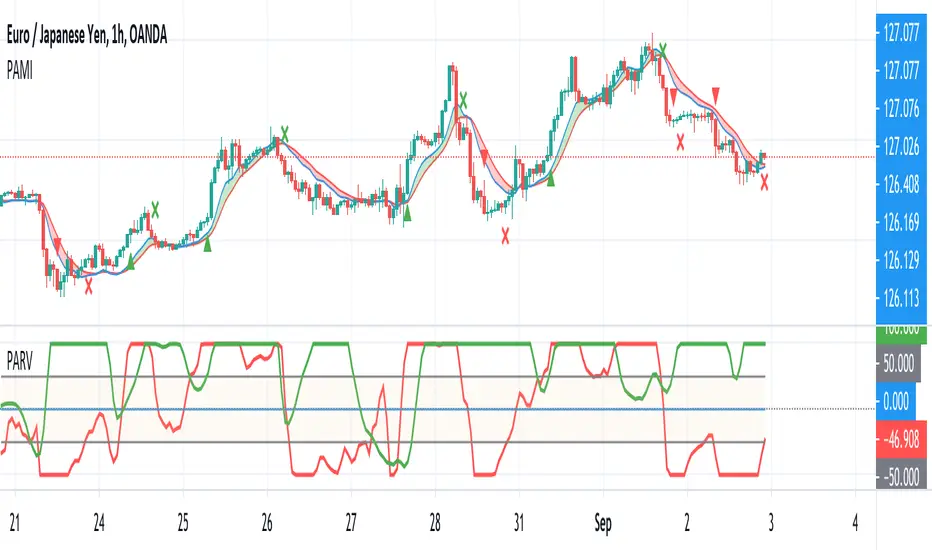
This indicator now includes two scripts in one.The green line indicates the relative volatility. Anything above zero is an indication that the market is becoming more volatile and where trades should be considered. Ideal trades are where the value has dipped below zero and then breaks the zero horizontal.
The red line is relating to the % of the candle in relation to the Bollinger band width. The value of 100 would indicate a long trade should be considered and a value of -100 would indicate a short trade should be considered.
免责声明
这些信息和出版物并不意味着也不构成TradingView提供或认可的金融、投资、交易或其它类型的建议或背书。请在使用条款阅读更多信息。