PROTECTED SOURCE SCRIPT
COT Raw Net Positions
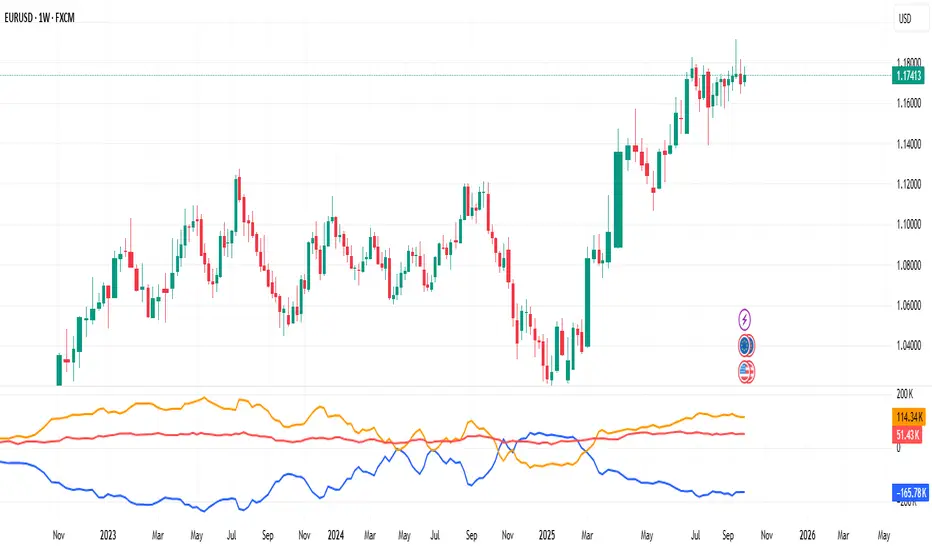
📊 What the COT Raw Data Shows — and Why It’s So Valuable
The COT Raw view displays the actual net positions of each trader group (Commercials, Large Speculators, and Retail/Small Traders) as reported weekly by the CFTC.
Instead of normalizing or smoothing the data, it shows the real contract numbers — how many futures contracts each group is long or short.
This raw form of the data offers pure transparency into market positioning.
It allows traders to:
See the true scale of institutional buying or selling pressure.
Understand how different market participants are behaving week to week.
Spot early accumulation or distribution phases long before they become visible on price charts.
Compare multiple assets side by side to gauge relative strength across markets.
While the COT Index simplifies things by showing where current positions sit relative to history, the COT Raw view provides context and depth — helping experienced traders understand why those extremes are forming.
In essence:
📈 COT Raw = the foundation of the data — it shows what’s really happening under the surface.
It’s a must-have for traders who want to study institutional flows, analyze correlations, and confirm macro sentiment shifts directly from the source.
⚠️ Note: As with all COT-based tools, the data updates weekly and is best interpreted on weekly or higher timeframes.
受保护脚本
此脚本以闭源形式发布。 但是,您可以自由使用它,没有任何限制 — 在此处了解更多信息。
免责声明
这些信息和出版物并不意味着也不构成TradingView提供或认可的金融、投资、交易或其它类型的建议或背书。请在使用条款阅读更多信息。
免责声明
这些信息和出版物并不意味着也不构成TradingView提供或认可的金融、投资、交易或其它类型的建议或背书。请在使用条款阅读更多信息。