INVITE-ONLY SCRIPT
已更新 Multi-Timeframe Trend Analysis [LevelUp]
Multi-Timeframe Trend Analysis was created through a collaborative effort with David Ryan, three-time winner of the U.S. Investing Championship. In addition to working with William O'Neil, founder of Investor's Business Daily, David managed the New USA Growth Fund at William O’Neil + Company.
Identifying Trends and Box Types
It's easy to get caught up with the noise of tracking price movement, bar by bar. This is even more relevant on lower timeframes. When performing trend analysis, it can be very helpful to step back and look at the bigger picture.
To help facilitate visualizing trends, with this indicator you can view higher timeframe data without changing to a new chart:
■ View the weekly trend from a daily chart.
■ View the monthly trend from a weekly chart.
■ View the quarterly trend from a monthly chart.
The weekly chart of GOOGL is shown below. Each box encapsulates one month of trading activity. You can also see the four types of boxes that may be shown: up, down, inside and outside.

Up Box - When a box highest high is above the previous box high, it is considered an up box. The percent change shows the increase from the previous box highest high to the highest high of the current box.
Down Box - When a box lowest low is below the previous box lowest low, it is considered a down box. The percent change shows the decrease from the previous box lowest low to the lowest low of the current box.
Inside Box - When a box highest high is below the previous box highest high, and the box lowest low is greater than the previous box lowest low, it is considered an inside box. Two percent changes are shown. One indicating the decrease from previous box highest high to the highest high of the current box. The other indicating the increase from the previous box lowest low to the lowest low of the current box.
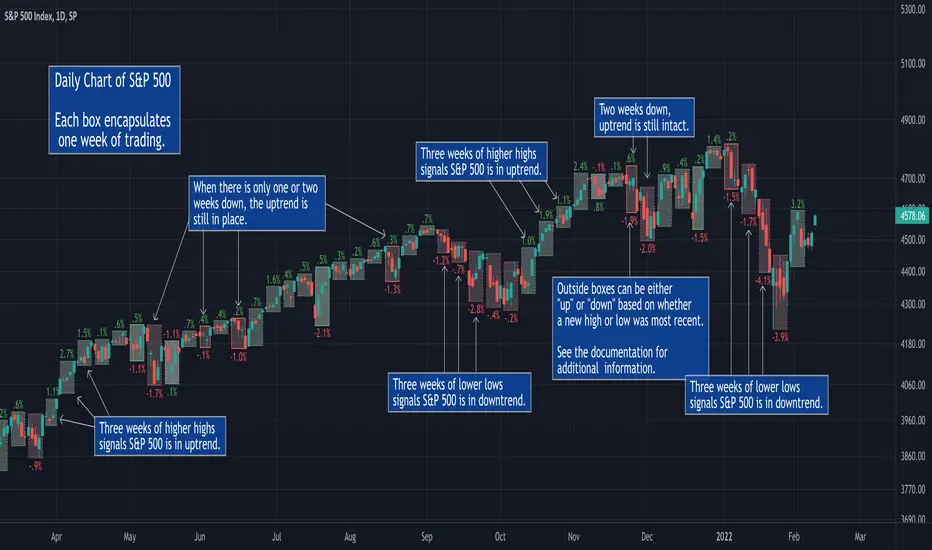
Outside Box - When a box highest high is above the previous box highest high, and the box lowest low is below the previous box lowest low, it is considered an outside box. Two percent changes are shown. One indicating the increase from previous box highest high to the highest high of the current box. The other indicating the decrease from the previous box lowest low to the lowest low of the current box.
Special Note for Outside Boxes: As far as outside boxes and whether they are continuing or changing the trend, it depends on the action of the most recent high or low. The box is considered to be an up box if the highest high is more recent than the lowest low, and vice versa.
How to Use the Indicator
The goal of this indicator is to help spot changes in the trend. Historical price data has shown that movements up/down often occur in threes. By looking for boxes encapsulating higher timeframe moves, we can see when a trend may be changing.
Three Higher Highs - If price movement is sideways or down and is followed by three consecutive higher highs, this may be the start of an uptrend.
Three Lower Lows - If price movement is sideways or up and is followed by three consecutive lower lows, this may be the start of a downtrend.

Percent Change Information
Each box has an optional percent (%) change value. Refer to the image and description below for more information.

Additional Examples


Features
■ View price action trends of higher timeframes without changing the chart timeframe.
■ View percent gain/loss from one box to another.
■ Customize box border and background colors.
■ Show/hide percent change values.
Identifying Trends and Box Types
It's easy to get caught up with the noise of tracking price movement, bar by bar. This is even more relevant on lower timeframes. When performing trend analysis, it can be very helpful to step back and look at the bigger picture.
To help facilitate visualizing trends, with this indicator you can view higher timeframe data without changing to a new chart:
■ View the weekly trend from a daily chart.
■ View the monthly trend from a weekly chart.
■ View the quarterly trend from a monthly chart.
The weekly chart of GOOGL is shown below. Each box encapsulates one month of trading activity. You can also see the four types of boxes that may be shown: up, down, inside and outside.
Up Box - When a box highest high is above the previous box high, it is considered an up box. The percent change shows the increase from the previous box highest high to the highest high of the current box.
Down Box - When a box lowest low is below the previous box lowest low, it is considered a down box. The percent change shows the decrease from the previous box lowest low to the lowest low of the current box.
Inside Box - When a box highest high is below the previous box highest high, and the box lowest low is greater than the previous box lowest low, it is considered an inside box. Two percent changes are shown. One indicating the decrease from previous box highest high to the highest high of the current box. The other indicating the increase from the previous box lowest low to the lowest low of the current box.
Outside Box - When a box highest high is above the previous box highest high, and the box lowest low is below the previous box lowest low, it is considered an outside box. Two percent changes are shown. One indicating the increase from previous box highest high to the highest high of the current box. The other indicating the decrease from the previous box lowest low to the lowest low of the current box.
Special Note for Outside Boxes: As far as outside boxes and whether they are continuing or changing the trend, it depends on the action of the most recent high or low. The box is considered to be an up box if the highest high is more recent than the lowest low, and vice versa.
How to Use the Indicator
The goal of this indicator is to help spot changes in the trend. Historical price data has shown that movements up/down often occur in threes. By looking for boxes encapsulating higher timeframe moves, we can see when a trend may be changing.
Three Higher Highs - If price movement is sideways or down and is followed by three consecutive higher highs, this may be the start of an uptrend.
Three Lower Lows - If price movement is sideways or up and is followed by three consecutive lower lows, this may be the start of a downtrend.
Percent Change Information
Each box has an optional percent (%) change value. Refer to the image and description below for more information.
Additional Examples
Features
■ View price action trends of higher timeframes without changing the chart timeframe.
■ View percent gain/loss from one box to another.
■ Customize box border and background colors.
■ Show/hide percent change values.
版本注释
Version 2.0■ Add support for Futures and Forex.
版本注释
Version 3.0■ Minor updates to Settings.
仅限邀请脚本
只有作者授权的用户才能访问此脚本。您需要申请并获得使用许可。通常情况下,付款后即可获得许可。更多详情,请按照下方作者的说明操作,或直接联系LevelUpTools。
TradingView不建议您付费购买或使用任何脚本,除非您完全信任其作者并了解其工作原理。您也可以在我们的社区脚本找到免费的开源替代方案。
作者的说明
Purchase the Multi-Timeframe Trend Analysis indicator as part of the Power Trend Pro Toolkit: https://PowerTrendPro.com
Join traders in over 40 countries and LevelUp!
tradingview.com/spaces/LevelUpTools/
tradingview.com/spaces/LevelUpTools/
免责声明
这些信息和出版物并非旨在提供,也不构成TradingView提供或认可的任何形式的财务、投资、交易或其他类型的建议或推荐。请阅读使用条款了解更多信息。