PROTECTED SOURCE SCRIPT
Trigger Line Candles
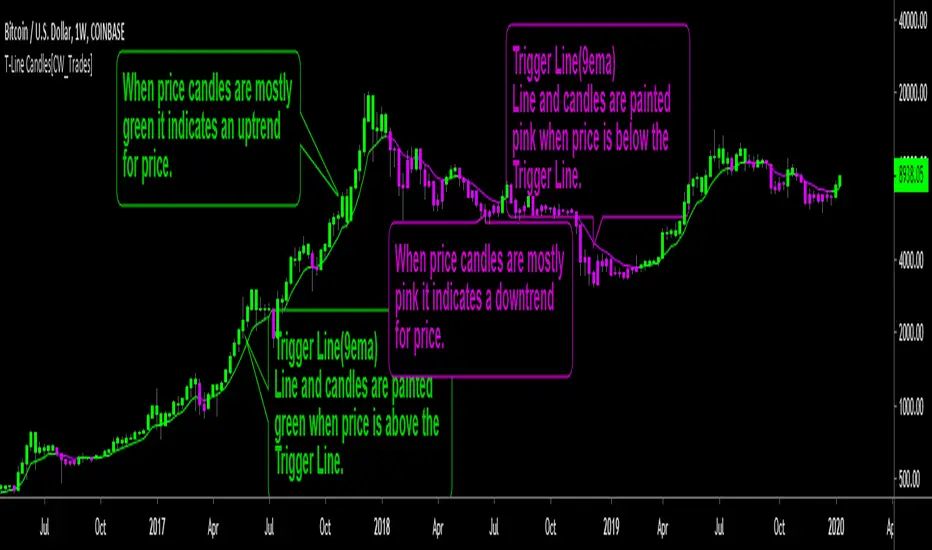
This is a trend indicator utilizing a 9-period exponential moving average, known as the Trigger Line. When price is above the Trigger Line both the candles and Trigger Line are colored green, indicating an uptrend for price. Price will tend to find support at the Trigger Line when trending above the Trigger Line. When price is below the Trigger Line both the candles and the Trigger Line are colored pink, indicating a downtrend for price. Price will tend to find resistance at the Trigger Line when trending below the Trigger Line.
Coloring price candles based on price relation to the Trigger Line paints a clearer picture of the true short-term trend behind price, rather than traditional price candles which only paint price in two colors representing individual candle up and down movement while no short-term trend identification is utilized.
Indicator inputs are editable; candle colors and T-Line can be turned on/off.
Indicator inspired by Stephen Bigalow's T-Line strategy.
受保护脚本
此脚本以闭源形式发布。 但是,您可以自由使用,没有任何限制 — 了解更多信息这里。
免责声明
这些信息和出版物并非旨在提供,也不构成TradingView提供或认可的任何形式的财务、投资、交易或其他类型的建议或推荐。请阅读使用条款了解更多信息。
受保护脚本
此脚本以闭源形式发布。 但是,您可以自由使用,没有任何限制 — 了解更多信息这里。
免责声明
这些信息和出版物并非旨在提供,也不构成TradingView提供或认可的任何形式的财务、投资、交易或其他类型的建议或推荐。请阅读使用条款了解更多信息。