OPEN-SOURCE SCRIPT
Kawasaki_MFI
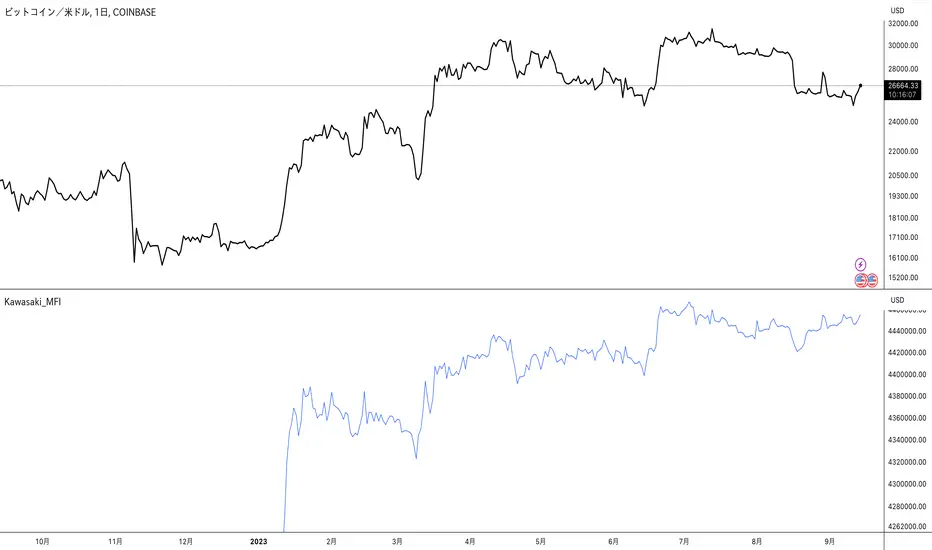
Kawasaki_MFI Indicator
The Kawasaki_MFI indicator is a customized technical analysis tool developed to analyze asset prices in financial markets. This script is implemented in TradingView's Pine Script language (version 5) and is based on the concept of the Accumulation/Distribution Line (ADL) which is a volume-based indicator designed to measure the cumulative flow of money into and out of a security.
Script Details
Version: Pine Script version 5
Overlay: True - The indicator is plotted directly on the price chart.
Input Variables
The script utilizes the following input variables sourced from daily (D) time frames:
High (my_high): The highest price of the security in the daily time frame.
Low (my_low): The lowest price of the security in the daily time frame.
Close (my_close): The closing price of the security in the daily time frame.
Volume (my_volume): The trading volume of the security in the daily time frame.
ADL Calculation
The ADL is calculated using the following formula:
ADL
=
Cumulative sum of ((Close−Low)−(High−Close)High−Low×Volume)
ADL=Cumulative sum of ( High−Low(Close−Low)−(High−Close)×Volume)
Plot
The ADL line is plotted on the chart with the following characteristics:
Title: ADL
Color: Blue
Usage
Traders can use the Kawasaki_MFI indicator to identify trends and potential reversal points in the market. A rising ADL line suggests buying pressure, while a falling ADL line suggests selling pressure. It can be used in conjunction with other technical indicators to develop a comprehensive trading strategy.
Feel free to add more details or modify the description to better suit your needs.
开源脚本
秉承TradingView的精神,该脚本的作者将其开源,以便交易者可以查看和验证其功能。向作者致敬!您可以免费使用该脚本,但请记住,重新发布代码须遵守我们的网站规则。
免责声明
这些信息和出版物并非旨在提供,也不构成TradingView提供或认可的任何形式的财务、投资、交易或其他类型的建议或推荐。请阅读使用条款了解更多信息。
开源脚本
秉承TradingView的精神,该脚本的作者将其开源,以便交易者可以查看和验证其功能。向作者致敬!您可以免费使用该脚本,但请记住,重新发布代码须遵守我们的网站规则。
免责声明
这些信息和出版物并非旨在提供,也不构成TradingView提供或认可的任何形式的财务、投资、交易或其他类型的建议或推荐。请阅读使用条款了解更多信息。