OPEN-SOURCE SCRIPT
Power Zone Trader (PZT)
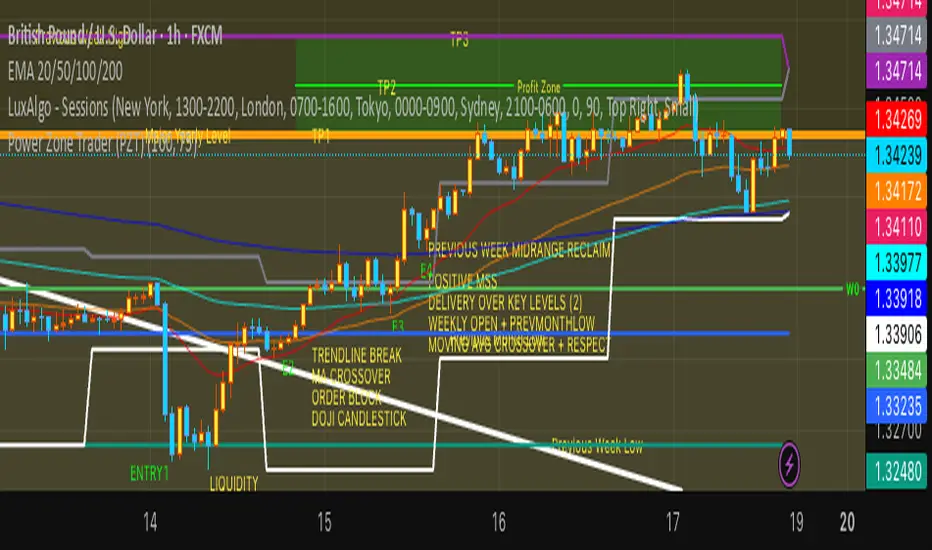
The PZT Indicator (Power Zone Trader ) is a multi-timeframe confluence system designed to identify and visualize natural support and resistance levels with exceptional clarity. By automatically mapping key structural highs and lows from higher timeframes, PZT allows traders to see where price is most likely to react, reverse, or accelerate, forming the foundation for high-probability trade setups. PZT highlights key reaction zones that influence order flow and trader behavior across all markets — including Forex, Crypto, Indices, and Commodities.
📍 Indicator Key
Each color represents a significant price level derived from its respective timeframe, helping traders instantly gauge market context and potential liquidity pools:
Color Level Represented Significance
🔴 Red Yearly High Strong resistance — potential selling pressure and major liquidity sweep zones.
🟢 Green Yearly Low Strong support — potential buying interest and accumulation points.
🟠 Orange Monthly High Intermediate resistance — swing rejection or continuation decision zone.
🔵 Blue Monthly Low Intermediate support — potential retracement or base-building area.
🟣 Purple Weekly High Short-term resistance — common rejection level or stop hunt zone.
🟤 Teal Weekly Low Short-term support — potential rebound or liquidity grab.
⚫ Gray Daily High Intraday resistance — active scalper and day trader interest.
⚪ White Daily Low Intraday support — short-term bounce or continuation pivot.
开源脚本
本着TradingView的真正精神,此脚本的创建者将其开源,以便交易者可以查看和验证其功能。向作者致敬!虽然您可以免费使用它,但请记住,重新发布代码必须遵守我们的网站规则。
免责声明
这些信息和出版物并不意味着也不构成TradingView提供或认可的金融、投资、交易或其它类型的建议或背书。请在使用条款阅读更多信息。
免责声明
这些信息和出版物并不意味着也不构成TradingView提供或认可的金融、投资、交易或其它类型的建议或背书。请在使用条款阅读更多信息。