OPEN-SOURCE SCRIPT
已更新 TPG.Buy sell RSI Scapl XAU
This is a tool that is widely used
Especially for Overbought and Oversold systems, but I have made some changes in this indicator,
How to use it...
I have set it as the default setting
- RSI Length: 6 (<10 for scalping - 5m-15m)
- Overbought: 70
- Oversold: 30
What is unique about this tool?
we can see 3 conditions:
1) RSI Overbought / Oversold with Bullish Engulfing / Bearish Engulfing
2) RSI Overbought / Oversold with Hammer and Shooting Star
3) RSI Overbought / Oversold with 2 Bullish Bars / 2 Bearish Bars
4) RSI Overbought / Oversold with All Patterns at the same time
When the RSI reaches its Oversold line, the code will wait for Bullish Engulfing pattren, when oversold and Bullish engulfing matched, This indicator will generate a buy signal when the condition is met,
and same as for Bear market, When the RSI reaches its Overbought line, the code will wait for Bearish Engulfing pattren, This indicator will generate a sell/exit signal when the condition is met,
2nd condition is that a Hammer candle will be waited for when RSI touches the Overbought line, for Bullish Move
and Shooting Star candle will be waited for when RSI touches the Overbought line, for Bullish Move, for Bearish Move
3rd Condition is also the same as Condition 1 and Condition 2,
When the RSI reaches its Oversold line, the code will wait for 2 Bullish Bars, when oversold and 2 Bullish Bars matched then this indicator will generate a buy signal, and same as for Bear market,
When the RSI reaches its Overbought line, the code will wait for 2 Bearish Bars, when overbought and 2 Bearish Bars matched then this indicator will generate a Sell signal,
4th Condition is that we can use All Conditions at the same time,
- Bullish Engulfing / Bearish Engulfing
- Hammer and Shooting Star
- 2 Bullish Bars / 2 Bearish Bars
版本注释
//version=5indicator("KenshinyTrump Editter", "TPG RSI Pro")
//------------------------------------------------------------------------------
//Settings
//-----------------------------------------------------------------------------{
length = input.int(14, minval = 2)
smoType1 = input.string('EMA', 'Method', options = ['EMA', 'SMA', 'RMA', 'TMA', 'WMA'])
src = input(close, 'Source')
arsiCss = input(color.silver, 'Color', inline = 'rsicss')
autoCss = input(true, 'Auto', inline = 'rsicss')
//Signal Line
smooth = input.int(21, minval = 1, group = 'Signal Line')
smoType2 = input.string('WMA', 'Method', options = ['EMA', 'SMA', 'RMA', 'TMA', 'WMA'], group = 'Signal Line')
signalCss = input(#ff5d00, 'Color', group = 'Signal Line')
//OB/OS Style
obValue = input.float(80, 'Overbought', inline = 'ob', group = 'OB/OS Style')
obCss = input(color.rgb(1, 122, 102), '', inline = 'ob', group = 'OB/OS Style')
obAreaCss = input(color.new(#089981, 80), '', inline = 'ob', group = 'OB/OS Style')
obValue1 = input.float(90, 'Overbought', inline = 'ob', group = 'OB/OS Style')
obCss1 = input(color.rgb(1, 122, 102), '', inline = 'ob', group = 'OB/OS Style')
obAreaCss1 = input(color.new(#089981, 80), '', inline = 'ob', group = 'OB/OS Style')
osValue = input.float(20, 'Oversold ', inline = 'os', group = 'OB/OS Style')
osCss = input(#f23645, '', inline = 'os', group = 'OB/OS Style')
osAreaCss = input(color.new(#f23645, 80), '', inline = 'os', group = 'OB/OS Style')
osValue1 = input.float(10, 'Oversold ', inline = 'os', group = 'OB/OS Style')
osCss1 = input(#f23645, '', inline = 'os', group = 'OB/OS Style')
osAreaCss1 = input(color.new(#f23645, 80), '', inline = 'os', group = 'OB/OS Style')
//-----------------------------------------------------------------------------}
//Functions
//-----------------------------------------------------------------------------{
ma(x, len, maType)=>
switch maType
'EMA' => ta.ema(x, len)
'SMA' => ta.sma(x, len)
'RMA' => ta.rma(x, len)
'WMA' => ta.ema(x, len)
'TMA' => ta.sma(ta.sma(x, len), len)
//-----------------------------------------------------------------------------}
//Augmented RSI
//-----------------------------------------------------------------------------{
upper = ta.highest(src, length)
lower = ta.lowest(src, length)
r = upper - lower
d = src - src[1]
diff = upper > upper[1] ? r
: lower < lower[1] ? -r
: d
num = ma(diff, length, smoType1)
den = ma(math.abs(diff), length, smoType1)
arsi = num / den * 50 + 50
signal = ma(arsi, smooth, smoType2)
//-----------------------------------------------------------------------------}
//Plots
//-----------------------------------------------------------------------------{
plot_rsi = plot(arsi, 'Ultimate RSI'
, arsi > obValue ? obCss
: arsi < osValue ? osCss
: autoCss ? chart.fg_color : arsiCss)
plot(signal, 'Signal Line', signalCss)
//Levels
plot_up = plot(obValue, color = na, editable = false)
plot_up1 = plot(obValue1, color = na, editable = false)
plot_avg = plot(50, color = na, editable = false)
plot_dn = plot(osValue, color = na, editable = false)
plot_dn1 = plot(osValue1, color = na, editable = false)
//OB-OS
fill(plot_rsi, plot_up, arsi > obValue ? obAreaCss : na)
fill(plot_dn, plot_rsi, arsi < osValue ? osAreaCss : na)
//Gradient
fill(plot_rsi, plot_avg, obValue, 50, obAreaCss, color.new(chart.bg_color, 100))
fill(plot_avg, plot_rsi, 50, osValue, color.new(chart.bg_color, 100), osAreaCss)
hline(obValue, 'Overbought')
hline(obValue1, 'Overbought')
hline(50, 'Midline')
hline(osValue, 'Oversold')
hline(osValue1, 'Oversold')
//-----------------------------------------------------------------------------}
//Signal Labels
//-----------------------------------------------------------------------------{
buySignal = ta.crossover(arsi, signal) and arsi < 50
sellSignal = ta.crossunder(arsi, signal) and arsi > 50
if buySignal
label.new(bar_index, signal, 'B', style=label.style_label_down, color=color.green, textcolor=color.white, size=size.small)
if sellSignal
label.new(bar_index, signal, 'S', style=label.style_label_up, color=color.red, textcolor=color.white, size=size.small)
版本注释
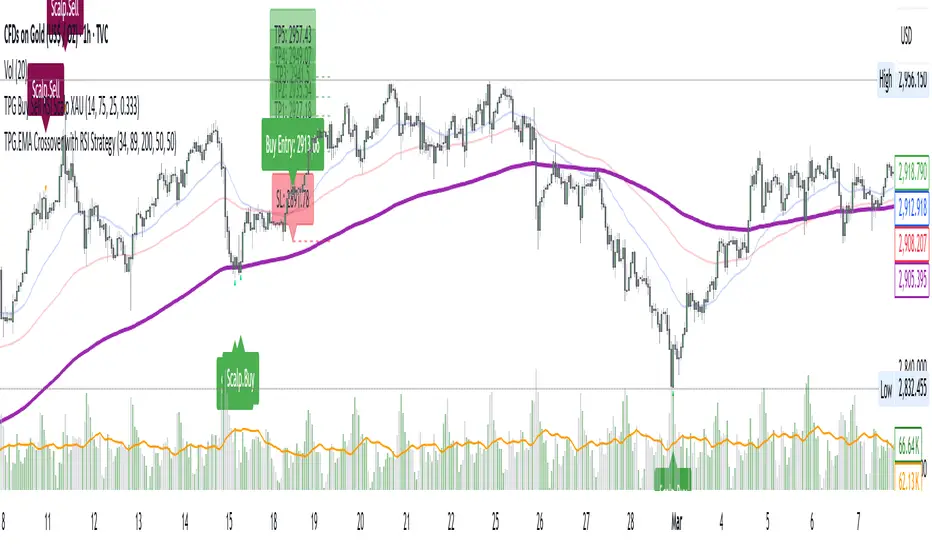
This script is designed to provide RSI-based buy and sell signals for scalping, specifically targeting XAU (Gold). It integrates RSI overbought/oversold conditions with various candlestick patterns like engulfing patterns, hammer/shooting star, and two consecutive bullish/bearish bars to identify potential entry points.Here's a quick breakdown of the features and logic:
RSI Setup:
RSI length is set by the input rsiL, defaulting to 7.
Overbought (rsiOBI) and oversold (rsiOSI) levels are set by inputs and default to 85 and 15, respectively.
RSI is calculated using the ta.rsi function, which drives the overbought and oversold logic for trade signals.
Hammer & Shooting Star Detection:
Hammers and shooting stars are detected by comparing the body of the candles relative to the fib level, combined with RSI oversold/overbought conditions.
If a valid hammer/shooting star forms and hammerShooting is enabled, signals are plotted.
Engulfing Candles:
Bullish and bearish engulfing candles are identified when one candle fully engulfs the previous one. This is combined with RSI overbought/oversold conditions for trade signals.
The user can enable/disable engulfing detection with BullBearEngulf.
Two Green/Red Bars:
Two consecutive bullish/bearish bars with RSI overbought/oversold are detected as potential signals when twoBullBearBar is enabled.
Trade Signal:
A trade signal is generated if RSI conditions (overbought/oversold) align with a bullish/bearish engulfing pattern, hammer/shooting star, or two consecutive bullish/bearish bars.
Visual labels are plotted on the chart for scalp sell/buy, hammer/shooting star, and two bullish/bearish bars, depending on conditions.
Alerts:
Alerts are set up to trigger when the TradeSignal condition is met. These can notify the user of a potential RSI scalp entry point.
开源脚本
In true TradingView spirit, the creator of this script has made it open-source, so that traders can review and verify its functionality. Kudos to the author! While you can use it for free, remember that republishing the code is subject to our House Rules.
免责声明
The information and publications are not meant to be, and do not constitute, financial, investment, trading, or other types of advice or recommendations supplied or endorsed by TradingView. Read more in the Terms of Use.