PROTECTED SOURCE SCRIPT
已更新 h/l raid @joshuuu
This indicator shows, when important liquidity pools have been taken out.
Which liquidity pools are important and how should I use them?
The day can be divided into different session. asia, london and new york session, those sessions can be narrowed down even further into killzones, taught by ict.
The times for those killzones are:
Asia - 2000-0000 ny time
London - 0200-0500 ny time
ny am - 0830-1100 ny time
nypm - 13.30-1600 ny time
Highs/Lows that have been created within those killzones (sessions with highest volume) should hold some liquidity.
That's why this indicator displays arrows with different colors to highlight once those highs/lows get taken out.
Additionally, the indicator also shows raids (liquidity grabs) of the previous daily, previous weekly and previous monthly high/low.
All colors are adaptable.
How do I use that indicator for my trading.
Once those important liquidity pools are taken out, we often see a reversal in the marketplace. One can wait for a raid and then watch for a potential market structure shift into the opposite direction to anticipate a reversal.
Note:
It is possible to create alerts for those kind of raids.
Examples:
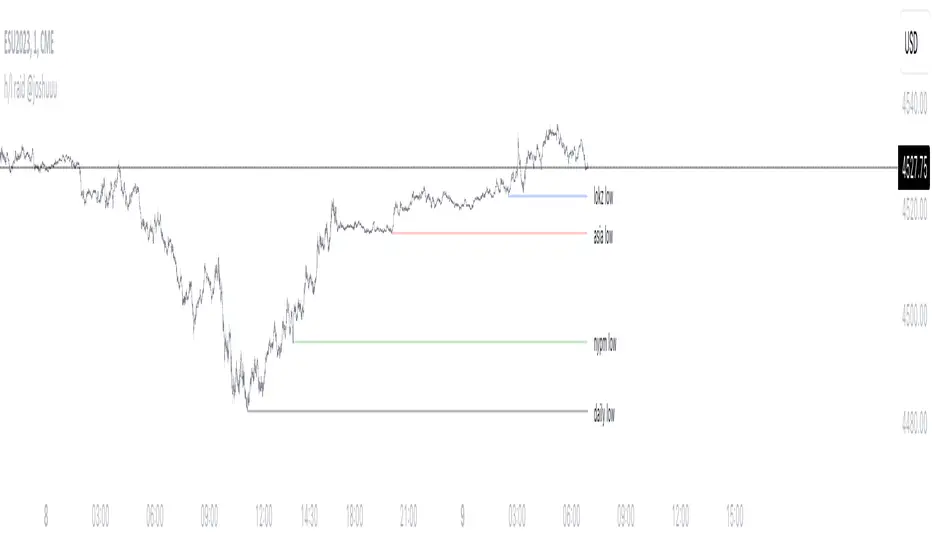
ES:

Price takes out Asia High (red triangle) and London High (blue triangle). Price then forms a market structure shift (lower low after a series of higher lows) and creates a fair value gap while doing so.
That would be a valid setup. Again, all these are concepts by TheInnerCircleTrader.
EU:

On this EurUsd Chart, we can see, how the triangles (liquidity grabs) can be an early indication for potential reversals.
Asia high and london high has been taken out. market structure shift (light bulb) and then a fairvalue gap.
Which liquidity pools are important and how should I use them?
The day can be divided into different session. asia, london and new york session, those sessions can be narrowed down even further into killzones, taught by ict.
The times for those killzones are:
Asia - 2000-0000 ny time
London - 0200-0500 ny time
ny am - 0830-1100 ny time
nypm - 13.30-1600 ny time
Highs/Lows that have been created within those killzones (sessions with highest volume) should hold some liquidity.
That's why this indicator displays arrows with different colors to highlight once those highs/lows get taken out.
Additionally, the indicator also shows raids (liquidity grabs) of the previous daily, previous weekly and previous monthly high/low.
All colors are adaptable.
How do I use that indicator for my trading.
Once those important liquidity pools are taken out, we often see a reversal in the marketplace. One can wait for a raid and then watch for a potential market structure shift into the opposite direction to anticipate a reversal.
Note:
It is possible to create alerts for those kind of raids.
Examples:
ES:
Price takes out Asia High (red triangle) and London High (blue triangle). Price then forms a market structure shift (lower low after a series of higher lows) and creates a fair value gap while doing so.
That would be a valid setup. Again, all these are concepts by TheInnerCircleTrader.
EU:
On this EurUsd Chart, we can see, how the triangles (liquidity grabs) can be an early indication for potential reversals.
Asia high and london high has been taken out. market structure shift (light bulb) and then a fairvalue gap.
版本注释
changed nykz to nyam and nypm版本注释
added the option to show lines of the liquidity pools版本注释
-option to enable/disable shapes-option to enable/disable lines
-option to set the label size
-option to set the label location
版本注释
fixed weekly/monthly color受保护脚本
此脚本以闭源形式发布。 但是,您可以自由使用,没有任何限制 — 了解更多信息这里。
免责声明
这些信息和出版物并非旨在提供,也不构成TradingView提供或认可的任何形式的财务、投资、交易或其他类型的建议或推荐。请阅读使用条款了解更多信息。
免责声明
这些信息和出版物并非旨在提供,也不构成TradingView提供或认可的任何形式的财务、投资、交易或其他类型的建议或推荐。请阅读使用条款了解更多信息。