OPEN-SOURCE SCRIPT
RS Rating for Indian Market
RS Rating for Trading View
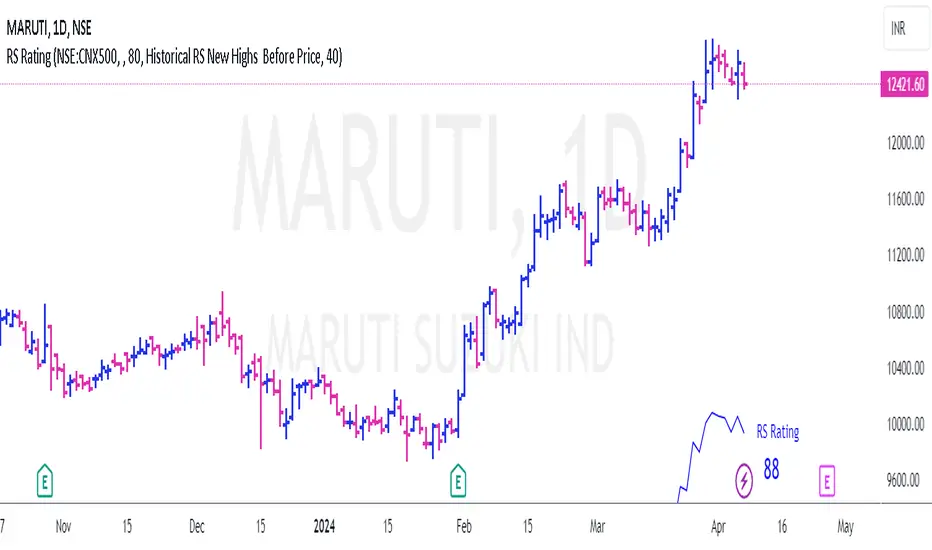
This Trading View script calculates the Relative Price Strength (RS) Rating for a given stock. It's a measure of a stock's price performance over the last twelve months, compared to all stocks in a selected Index. The rating scale ranges from 1 (lowest) to 99 (highest).
Features
- Adaptation for Indian Market
- Option to choose the index to compare to (NSE:NIFTY, NSE:CNX500, NSE:NIFTYSMLCAP250, NSE:CNXSMALLCAP)
- Option to compare to a different index
- Option to hide the RS rating
- Option to plot RS new highs
- Option to adjust the offset of the line for display purposes
- Option to change the color of the RS Line & Rating
- Option to change the color of the dots for RS new highs
- Option to choose which new high to plot (RS New Highs, RS New Highs Before Price, Historical RS New Highs, Historical RS New Highs Before Price)
- Option to adjust the recent high look-back count
Please note that the script is designed to work best in the daily timeframe. Results may not be accurate in other timeframes.
This script uses three methods to calculate the RS Rating:
1. A method that calculates how the stock behaves vs SMA.
2. A classic performance method that calculates the performance of the stock's closing price vs the closing price 3 months back.
3. A method that measures how the stock performs against the comparative Symbol.
The final RS Rating is a combination of the results from these three methods. The script also includes some adjustments based on observations to improve the accuracy of the rating.
开源脚本
秉承TradingView的精神,该脚本的作者将其开源,以便交易者可以查看和验证其功能。向作者致敬!您可以免费使用该脚本,但请记住,重新发布代码须遵守我们的网站规则。
免责声明
这些信息和出版物并非旨在提供,也不构成TradingView提供或认可的任何形式的财务、投资、交易或其他类型的建议或推荐。请阅读使用条款了解更多信息。
开源脚本
秉承TradingView的精神,该脚本的作者将其开源,以便交易者可以查看和验证其功能。向作者致敬!您可以免费使用该脚本,但请记住,重新发布代码须遵守我们的网站规则。
免责声明
这些信息和出版物并非旨在提供,也不构成TradingView提供或认可的任何形式的财务、投资、交易或其他类型的建议或推荐。请阅读使用条款了解更多信息。