INVITE-ONLY SCRIPT
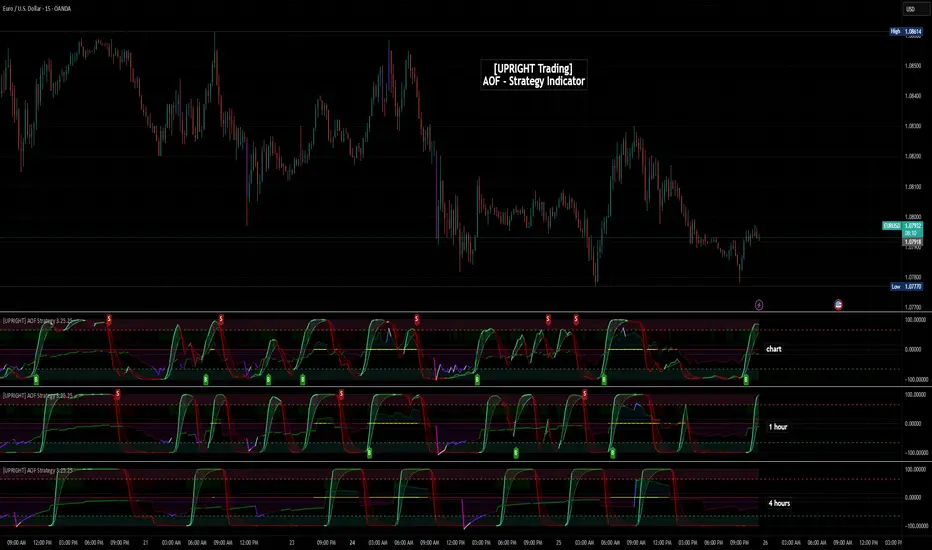
已更新 [UPRIGHT Trading] Academy of Forex - Scalp Strategy
█ OVERVIEW
This is a collaboration of efforts of The Academy of Forex and UPRIGHT Trading.
The Academy of Forex - Scalp Strategy Indicator is a clean & reimagined lower indicator. To enable optimization & potential automation, we re-coded & optimized it at UPRIGHT Trading.
It is based on the one presented on its YT channel.
The idea is for it to be an easy to use - simple indicator - that works not just for confirmation, but also entering and exiting quickly (scalping).
█ CONCEPTS
The idea is that %B (derived from BBs) is able to pick up some pretty significant moves. With that as one of the bases the Inverse Fisher Transform (Ribbon) acts to show some of the movement of the asset highlighting when it at extremes. The RSI highlights are there as another confirmation to help normalize the sometimes too frequent movement of %B.
As expected the indicator often acts as a reversal indicator, but with the optimizations of logic it's able to pick up more than just the reversals and works as a pretty decent Buy/Sell Algorithm.
█ CALCULATIONS
Calculations used included, but not limited to:
- %B - Quantifies the price as a percentage to the Upper and Lower Band of the Popular Bollinger Bands, which were named after their inventor John Bollinger in 1980.
- Inverse Fisher Transform RSI - is a variation of the IFT, created by John Ehlers, the idea is for the IFT to convert Gaussian normal distribution and to take it a step further the RSI version is to just use overbought and oversold placements. This indicator is meant to highlight when price has moved to an extreme and in this process helps to spot turning points.
- Relative Strength Index (RSI) - As most of you know already the RSI is a technical analysis tool invented by J. Welles Wilder, that oscillates and is used to measure the momentum of price changes. It normalizes to index 0-100 with overbought and oversold defined by the user, but often around 70 as overbought and 30 as oversold.
- Pivot/Swing Points - Implemented to show recent Higher-Highs or Lower-Lows, Pivot points are included in the indicator for structure tracking.
- Moving Averages - Moving averages help to get an idea of when price is moving near the norm or outside to extremes.
█ FEATURES
Indicator Features:
Showing some of the signals close up.

Should look like this:

Enjoy!
Sincerely,
Mike
This is a collaboration of efforts of The Academy of Forex and UPRIGHT Trading.
The Academy of Forex - Scalp Strategy Indicator is a clean & reimagined lower indicator. To enable optimization & potential automation, we re-coded & optimized it at UPRIGHT Trading.
It is based on the one presented on its YT channel.
The idea is for it to be an easy to use - simple indicator - that works not just for confirmation, but also entering and exiting quickly (scalping).
█ CONCEPTS
The idea is that %B (derived from BBs) is able to pick up some pretty significant moves. With that as one of the bases the Inverse Fisher Transform (Ribbon) acts to show some of the movement of the asset highlighting when it at extremes. The RSI highlights are there as another confirmation to help normalize the sometimes too frequent movement of %B.
As expected the indicator often acts as a reversal indicator, but with the optimizations of logic it's able to pick up more than just the reversals and works as a pretty decent Buy/Sell Algorithm.
█ CALCULATIONS
Calculations used included, but not limited to:
- %B - Quantifies the price as a percentage to the Upper and Lower Band of the Popular Bollinger Bands, which were named after their inventor John Bollinger in 1980.
- Inverse Fisher Transform RSI - is a variation of the IFT, created by John Ehlers, the idea is for the IFT to convert Gaussian normal distribution and to take it a step further the RSI version is to just use overbought and oversold placements. This indicator is meant to highlight when price has moved to an extreme and in this process helps to spot turning points.
- Relative Strength Index (RSI) - As most of you know already the RSI is a technical analysis tool invented by J. Welles Wilder, that oscillates and is used to measure the momentum of price changes. It normalizes to index 0-100 with overbought and oversold defined by the user, but often around 70 as overbought and 30 as oversold.
- Pivot/Swing Points - Implemented to show recent Higher-Highs or Lower-Lows, Pivot points are included in the indicator for structure tracking.
- Moving Averages - Moving averages help to get an idea of when price is moving near the norm or outside to extremes.
█ FEATURES
Indicator Features:
- -2 Buy/Sell Signals.
- -U Signals (UPRIGHT optimized).
- -Exit Reminders.
- -Alerts allowing Automation of Scalp Strategy.
- -H/L Swings.
- -Color Customization.
- -Clean Mode.
- -Inverse Fisher Transform Ribbon.
- -RSI Bullish/Bearish Highlights.
- -Options for More Signals (including: Oversold/Overbought Circles, %B Bull/Bear Squares and Triangles, and IFT Highlights).
Showing some of the signals close up.
Should look like this:
Enjoy!
Sincerely,
Mike
版本注释
Update 7.27:- Added MTF (multi-time frame) - it will adjust where the signals are so do take notice of those.
- Optimized B/S2 - some entries will be slightly sooner.
- Cleaned the UI a little bit.
Enjoy :)
版本注释
Update 8.14:- Added Color Customization for RSI Highlights.
- Transparency Adjustment for RSI Highlights.
- A few other minor adjustments.
版本注释
-short label.版本注释
UPDATE 9.12:--Added Mean Reversion confirmation.
--Beta M-R cloud.
--Added U Signals to Alert Condition.
--Some B/S adjustments
版本注释
--Bug fixes--Code cleaning
版本注释
--Slight adjustments to zscore colors.--Added more customization for MA+ and zscore colors.
版本注释
Update 12.16:--Improved UI.
--Better Aesthetics for MR.
--More Options.
--Mean Rev improvements.
--Default Settings adjusted.
--Some Code Cleaning.
版本注释
Update 12.16 v2:- New (beta feature) : Center Trend MA Option to Track direction.
---Choose 1 or both to assist in trend tracking.
版本注释
UPDATE 1.3.24:- Some Alert adjustments.
- NEW! Exit 3 (beta).
- Removal of U Signals in prep for ML signals under B/S 2.
版本注释
UPDATE 1.18:--Bug fixes.
--MA Line color improvements.
--Some MA+ Improvements. (more to come)
版本注释
- Some UI adjustments.
- Added Colored bars for Strategy (beta)
版本注释
--Added Yellow TP/SL版本注释
--Candles off by default.--Moved the adjustments up in settings.
--Some UI changes.
版本注释
UPDATE 2.2.24:--A few more bug fixes that didn't update for some reason.
--Added it to the chart above.
--Remember: Bar candles are in beta, off by default for now. They can help with trend tracking. Easier to see with candle border off.
Should look like this
版本注释
--Yellow TP/SL Candle bug fix. --Small adjustments to the the Perimeters.
**Remember to turn the Break Candles on - Toggles is in settings.
Remove old and add new version for this update.
版本注释
UPDATE 2.16:- Band-Break Candles adjustments.
- NEW! ATR Candles integrated.
- Toggle Band-Break & ATR Candles to turn on (off by default)
- NEW! Can turn off Band-Break Candles and still have ATR candle filter on (light gray).
- Added adjustable lines for testing.
版本注释
Quick Update: --ATR Candles on by default.
(Tracks when an ATR violation/jump occurs)
版本注释
-- Mostly UI updates-- Added Green/Red IFT Alert (all-functions)
-- A little code cleaning as well.
版本注释
UPDATE 6.4.24:- Clean Mode is back and it's toggle will bring you to the latest setup.
- ATR built-in candles are now Purple.
- White MR bounce is now a Greyish hue.
- Added MR Cross Alert in Settings to be checked.
- A few other small adjustments.
Light
版本注释
UPDATE 7.29:- Fixes MR Cross Alerts.
- Adds more Alert options: 1) Every threshold cross 2) Moving in direction of trade cross
- Adds Legacy alert for #2 mentioned above.
- Some code cleaning.
I'll consider threshold adjustment in the future - currently the 65/-65.
Another possible one is the cross of 0.
These will be looked at.
版本注释
--Version Name updated.版本注释
Update 8.20.24:- NEW! Alerts now have a confirmed close option - Scroll down and see tooltip for details.
- Added a toggle to remove old Exits from old strat - that have to repaint.
- Cleaned code.
- Both new options are checked by default.
These updates will be added to beta shortly.
版本注释
UPDATE 8.21:-Fully implements the Confirm option for Alerts.
-Consolidates Alerts - The ones that are on the chart for legacy will be alerted for B/S/Exit.
-Code cleaning and some syncing with beta.
-Other minor adjustments.
版本注释
UPDATE 10.17:--Alert logic greatly improved.
--Confirmation of Alerts improved.
--Separated MRev alert and enhanced it in anyfunction()
--IFT color change only alerts once.
--MR OS/OB alerts once now.
--Alert triggers as soon as confirmed with "Confirm" on.
版本注释
--Alerts fixed.--MTF required removal as part of fix (until something is changed in TVs code).
版本注释
--Quick fix from cleaning code.版本注释
--One last cleanup for the night.版本注释
--ATR Candle Enhancements.--Added option for "Current" ATR or "Candle Tracking ATR" Mode.
--Big cleaning of the Settings UI (better sorted).
--Code cleaning.
版本注释
--Color adjustments for new ATR mode.版本注释
--Code cleaning.--Updated to Pine v6
版本注释
Update 2.13.25:--Added Alert Msg boxes for Webhook support in settings.
版本注释
--Title typo fixed.--Small code tweaks.
版本注释
UPDATE 3.25.25:--Fixed and Added back MTF with complex logic (finally)
--Added 'External' for Source option.
仅限邀请脚本
只有作者授权的用户才能访问此脚本。您需要申请并获得使用许可。通常情况下,付款后即可获得许可。更多详情,请按照下方作者的说明操作,或直接联系UPRIGHTTrading。
TradingView不建议您付费购买或使用任何脚本,除非您完全信任其作者并了解其工作原理。您也可以在我们的社区脚本找到免费的开源替代方案。
作者的说明
https://uprighttrades.com/plan-pricing for free trial; more information/access.
Site: uprighttrades.com
Scripts: tradingview.com/u/UPRIGHTTrading/
Like & follow for great ideas, indicators, and to see what I've been working on to my your trading easier for you.
Scripts: tradingview.com/u/UPRIGHTTrading/
Like & follow for great ideas, indicators, and to see what I've been working on to my your trading easier for you.
免责声明
这些信息和出版物并非旨在提供,也不构成TradingView提供或认可的任何形式的财务、投资、交易或其他类型的建议或推荐。请阅读使用条款了解更多信息。