OPEN-SOURCE SCRIPT
@Cross_Media&Pivot&TRADE_Entry_and_Exit
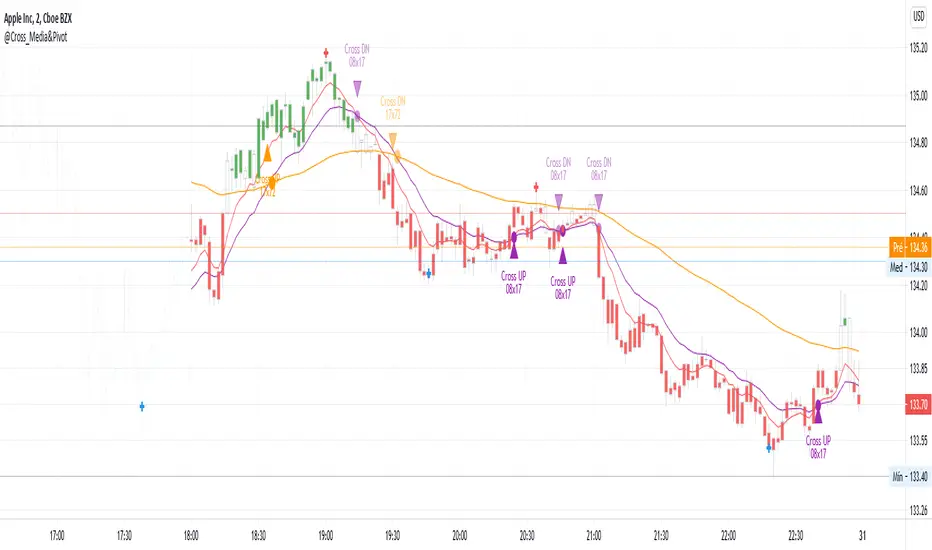
This script uses the functions plot(), cross(), plotcandle(), pivothigh() and pivotllow(). You can see the candles in the color green, above EMA 72 (Exponetional Move Average), and the color red, below EMA72. You can identify the position of the crossing UP and DOWN of the EMA 08 x EMA 17, EMA 17 x EMA72. You can identify the TRADE ENTRY points with the pivot high and TRADE EXIT with the pivot Low.
开源脚本
秉承TradingView的精神,该脚本的作者将其开源,以便交易者可以查看和验证其功能。向作者致敬!您可以免费使用该脚本,但请记住,重新发布代码须遵守我们的网站规则。
免责声明
这些信息和出版物并非旨在提供,也不构成TradingView提供或认可的任何形式的财务、投资、交易或其他类型的建议或推荐。请阅读使用条款了解更多信息。
开源脚本
秉承TradingView的精神,该脚本的作者将其开源,以便交易者可以查看和验证其功能。向作者致敬!您可以免费使用该脚本,但请记住,重新发布代码须遵守我们的网站规则。
免责声明
这些信息和出版物并非旨在提供,也不构成TradingView提供或认可的任何形式的财务、投资、交易或其他类型的建议或推荐。请阅读使用条款了解更多信息。