OPEN-SOURCE SCRIPT
CUSUM Peaks & Troughs with Drift
This script implements an Improved CUSUM (Cumulative Sum) Peaks & Troughs with Drift indicator. Here's a breakdown of how it works:
Input Parameters:
cusumThreshold: Threshold value for detecting peaks and troughs.
cusumDrift: Drift value used to adjust the CUSUM calculation.
movingAverageLength: Length of the moving average used as a reference for deviation calculation.
Moving Average Calculation:
Calculates the simple moving average (SMA) of the closing prices over a specified length.
Price Deviation Calculation:
Computes the deviation of the closing price from the moving average.
CUSUM Calculation with Drift:
Utilises cumulative sum (CUSUM) calculations with drift adjustment.
Tracks positive and negative deviations from the moving average, considering the specified drift value.
Peak and Trough Detection:
Detects peaks and troughs based on the predefined thresholds (cusumThreshold).
Resets the CUSUM values when peaks or troughs are detected.
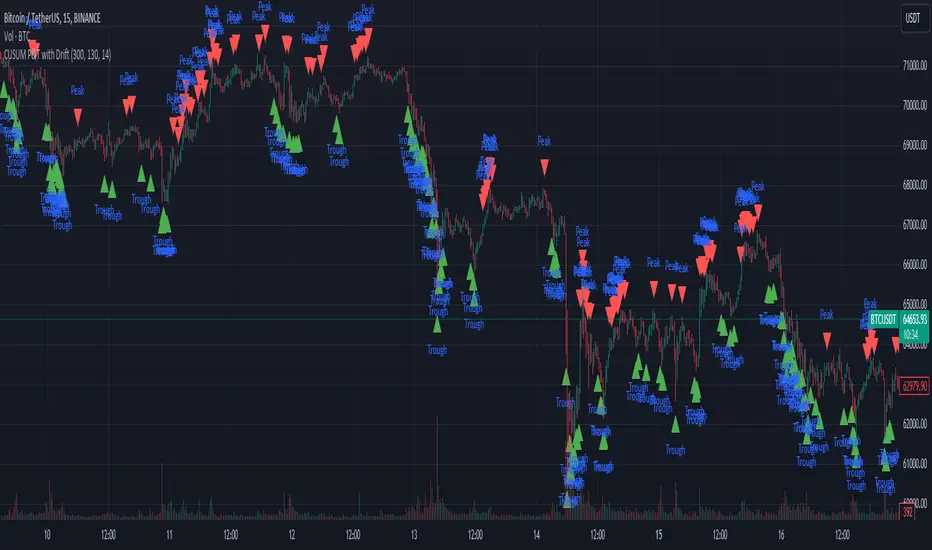
Plotting:
Plots shapes (triangles) above the bars for peaks and below the bars for troughs.
Optionally, you can uncomment the lines to visualise the CUSUM values and the zero line for reference.
This indicator helps identify potential turning points or reversals in the price action by detecting peaks (high points) and troughs (low points) in the cumulative sum of price deviations from the moving average, considering drift to adapt to underlying trends in the data.
Input Parameters:
cusumThreshold: Threshold value for detecting peaks and troughs.
cusumDrift: Drift value used to adjust the CUSUM calculation.
movingAverageLength: Length of the moving average used as a reference for deviation calculation.
Moving Average Calculation:
Calculates the simple moving average (SMA) of the closing prices over a specified length.
Price Deviation Calculation:
Computes the deviation of the closing price from the moving average.
CUSUM Calculation with Drift:
Utilises cumulative sum (CUSUM) calculations with drift adjustment.
Tracks positive and negative deviations from the moving average, considering the specified drift value.
Peak and Trough Detection:
Detects peaks and troughs based on the predefined thresholds (cusumThreshold).
Resets the CUSUM values when peaks or troughs are detected.
Plotting:
Plots shapes (triangles) above the bars for peaks and below the bars for troughs.
Optionally, you can uncomment the lines to visualise the CUSUM values and the zero line for reference.
This indicator helps identify potential turning points or reversals in the price action by detecting peaks (high points) and troughs (low points) in the cumulative sum of price deviations from the moving average, considering drift to adapt to underlying trends in the data.
开源脚本
秉承TradingView的精神,该脚本的作者将其开源,以便交易者可以查看和验证其功能。向作者致敬!您可以免费使用该脚本,但请记住,重新发布代码须遵守我们的网站规则。
免责声明
这些信息和出版物并非旨在提供,也不构成TradingView提供或认可的任何形式的财务、投资、交易或其他类型的建议或推荐。请阅读使用条款了解更多信息。
免责声明
这些信息和出版物并非旨在提供,也不构成TradingView提供或认可的任何形式的财务、投资、交易或其他类型的建议或推荐。请阅读使用条款了解更多信息。