PROTECTED SOURCE SCRIPT
已更新 Sessions and Market Structure Highs and Lows
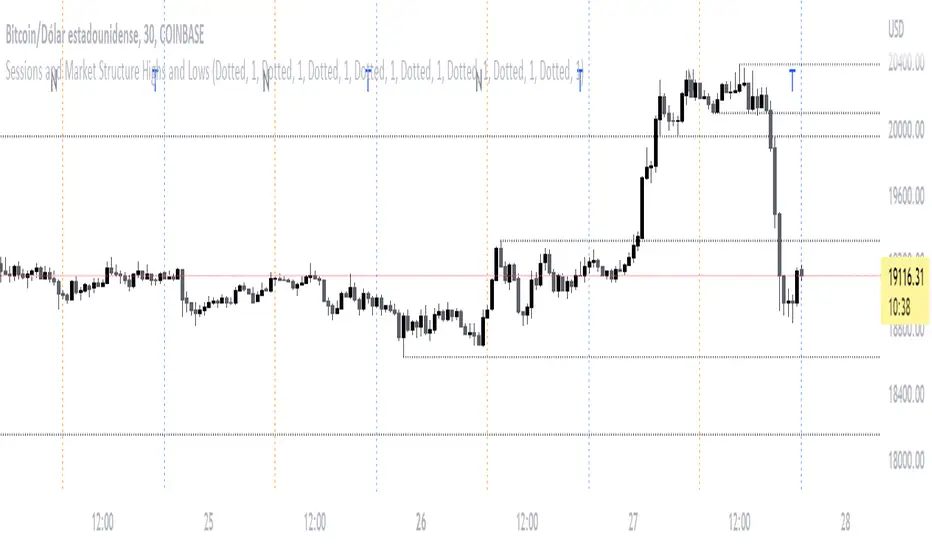
This Indicator has the purpose that traders can see the opening of the different sessions on the chart in a clean and visually pleasing way.
By adding the script to your chart, vertical lines will automatically appear at the specific opening hours of each session
What schedules are used by the Script?
Keep in mind that the style of the line can be modified from the indicator settings, by the way in case you do not want to see the main letter of each session on the chart, you can also deactivate it from the settings
Also, in a very entertaining way, you will be able to see the Highs and Lows of the corresponding temporalities.
By adding the script to your chart, vertical lines will automatically appear at the specific opening hours of each session
What schedules are used by the Script?
- The New York session starts at 07:30 GMT and its line will be represented by the color Orange
- Then for the London session the start is plotted at 03:30 GMT with the Gray line
- And finally the Asia/Tokyo session at 19:00 GMT with its Blue color line
Keep in mind that the style of the line can be modified from the indicator settings, by the way in case you do not want to see the main letter of each session on the chart, you can also deactivate it from the settings
Also, in a very entertaining way, you will be able to see the Highs and Lows of the corresponding temporalities.
版本注释
You can define open sessions time受保护脚本
此脚本以闭源形式发布。 但是,您可以自由使用,没有任何限制 — 了解更多信息这里。
免责声明
这些信息和出版物并非旨在提供,也不构成TradingView提供或认可的任何形式的财务、投资、交易或其他类型的建议或推荐。请阅读使用条款了解更多信息。
受保护脚本
此脚本以闭源形式发布。 但是,您可以自由使用,没有任何限制 — 了解更多信息这里。
免责声明
这些信息和出版物并非旨在提供,也不构成TradingView提供或认可的任何形式的财务、投资、交易或其他类型的建议或推荐。请阅读使用条款了解更多信息。