OPEN-SOURCE SCRIPT
Choose Symbol, candle and line mode
This indicator plots candlesticks or line charts based on user-specified symbol and price data in the time frame. The user can also choose whether this indicator works in normal mode or Heikin-Ashi mode. Here are the features of this indicator:
1. **Trend and Normal Modes:** User can choose to operate the indicator in two different modes. In "Trend Mode" the indicator plots the moving average of the price based on the specified period length. In the "Normal Mode", it draws the opening, high, low and closing prices similar to the Heikin-Ashi candlesticks.
2. **Time Zone Selection:** User can select a different time zone to operate this indicator. By default, the current chart timeframe is used.
3. **Symbol Selection:** The indicator uses the price data from the specified symbol. The user can specify the symbol in the format "SYMBOL:PAIR".
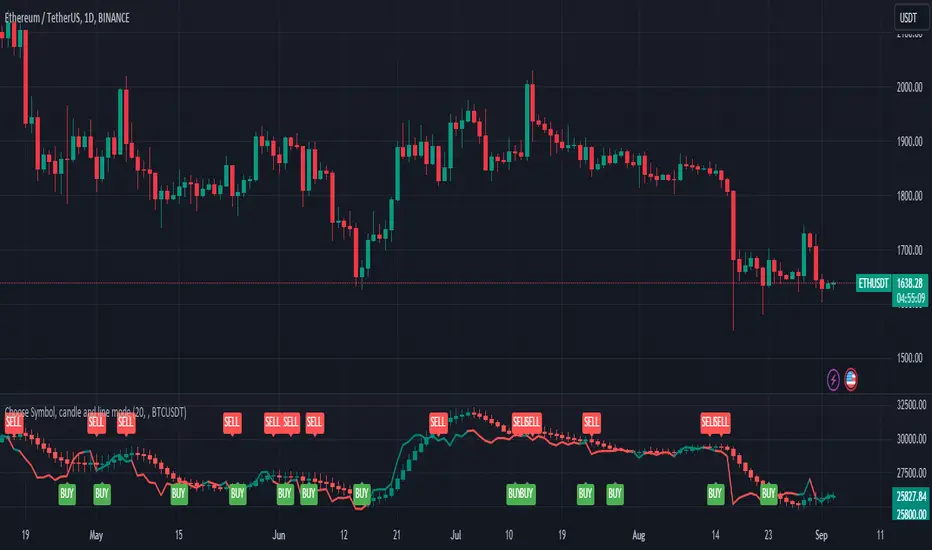
4. **Buy-Sell Signals:** The indicator identifies buy and sell signals based on a certain period length. A buy signal occurs when the price goes above the line, while a sell signal occurs when the price goes below the line.
5. **Buy-Sell Alerts:** Alerts are sent to the user for buying and selling signals.
6. **Display on Chart:** The indicator draws candlesticks or line chart with specified modes and colors. It also marks the buying and selling points on the chart.
This indicator is used to analyze price movements in the specified symbol and time frame and to assist in buying and selling decisions. It has a user-friendly and customizable interface.
It is for idea purposes only, does not contain investment advice.
1. **Trend and Normal Modes:** User can choose to operate the indicator in two different modes. In "Trend Mode" the indicator plots the moving average of the price based on the specified period length. In the "Normal Mode", it draws the opening, high, low and closing prices similar to the Heikin-Ashi candlesticks.
2. **Time Zone Selection:** User can select a different time zone to operate this indicator. By default, the current chart timeframe is used.
3. **Symbol Selection:** The indicator uses the price data from the specified symbol. The user can specify the symbol in the format "SYMBOL:PAIR".
4. **Buy-Sell Signals:** The indicator identifies buy and sell signals based on a certain period length. A buy signal occurs when the price goes above the line, while a sell signal occurs when the price goes below the line.
5. **Buy-Sell Alerts:** Alerts are sent to the user for buying and selling signals.
6. **Display on Chart:** The indicator draws candlesticks or line chart with specified modes and colors. It also marks the buying and selling points on the chart.
This indicator is used to analyze price movements in the specified symbol and time frame and to assist in buying and selling decisions. It has a user-friendly and customizable interface.
It is for idea purposes only, does not contain investment advice.
开源脚本
秉承TradingView的精神,该脚本的作者将其开源,以便交易者可以查看和验证其功能。向作者致敬!您可以免费使用该脚本,但请记住,重新发布代码须遵守我们的网站规则。
免责声明
这些信息和出版物并非旨在提供,也不构成TradingView提供或认可的任何形式的财务、投资、交易或其他类型的建议或推荐。请阅读使用条款了解更多信息。
免责声明
这些信息和出版物并非旨在提供,也不构成TradingView提供或认可的任何形式的财务、投资、交易或其他类型的建议或推荐。请阅读使用条款了解更多信息。