OPEN-SOURCE SCRIPT
已更新 Sessions Rainbow EST with overlaps

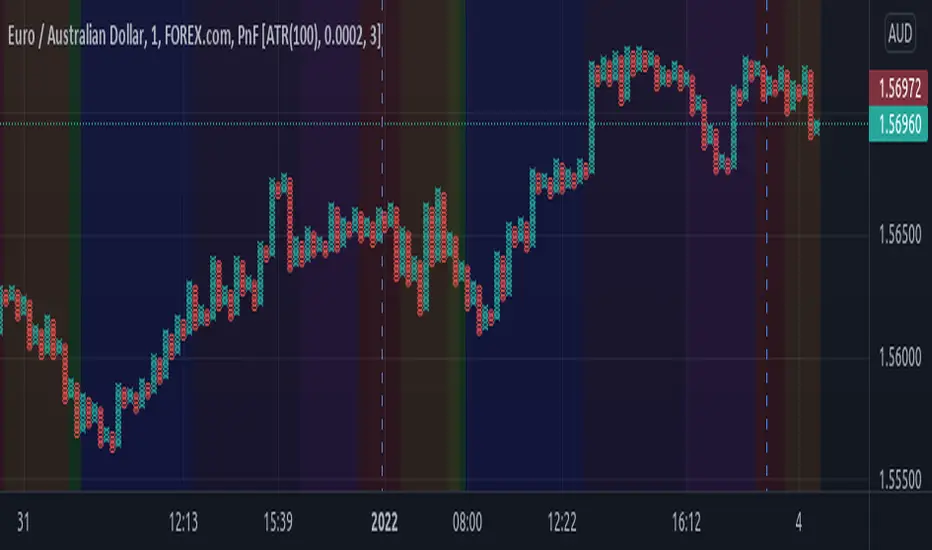
This script displays the trading zones with overlaps based on the color of the rainbow. It is used with a Point&Figure chart to show trends associated with trading periods and overlapping trading periods.
版本注释
Reordered so that Sydney starts the daily rainbow session with red, ending with New York as violet.开源脚本
In true TradingView spirit, the creator of this script has made it open-source, so that traders can review and verify its functionality. Kudos to the author! While you can use it for free, remember that republishing the code is subject to our House Rules.
免责声明
The information and publications are not meant to be, and do not constitute, financial, investment, trading, or other types of advice or recommendations supplied or endorsed by TradingView. Read more in the Terms of Use.
开源脚本
In true TradingView spirit, the creator of this script has made it open-source, so that traders can review and verify its functionality. Kudos to the author! While you can use it for free, remember that republishing the code is subject to our House Rules.
免责声明
The information and publications are not meant to be, and do not constitute, financial, investment, trading, or other types of advice or recommendations supplied or endorsed by TradingView. Read more in the Terms of Use.