INVITE-ONLY SCRIPT
已更新 CAD Data
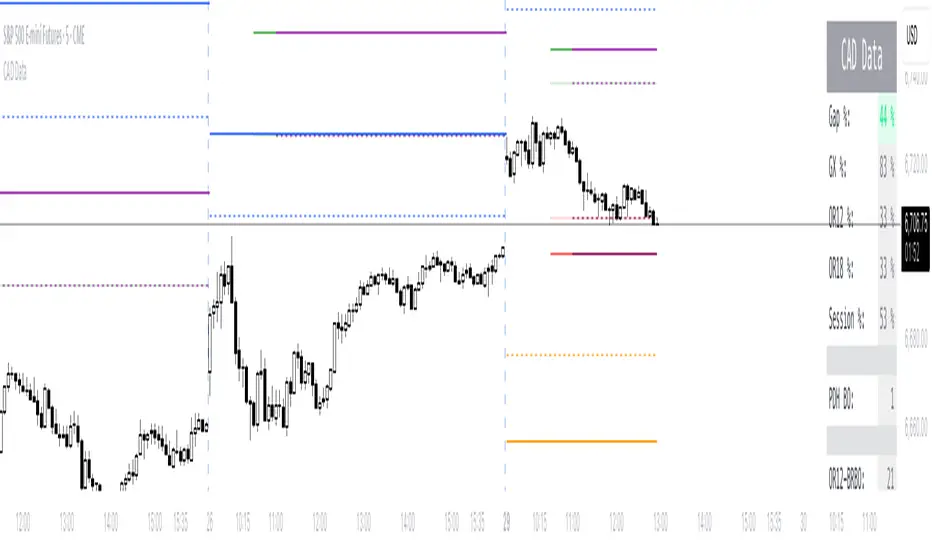
This indicator provides all of the data required to use the Context Analysis Dashboard (CAD) for live trading.
版本注释
Updated to properly color the opening gap field and remove clutter from spacers inside of sections that don't have data. 版本注释
Added table name. 版本注释
Simplified calculations for Globex data. 版本注释
Updated font to monospace and removed GapDir Range until the corresponding feature is added to CAD.版本注释
CAD Data Indicator - Major UpdateWe're excited to release a significant update to the CAD Data indicator that introduces visual target lines and comprehensive backtesting data.
What's New
1. Visual Target Lines on Chart
The indicator now displays measured move target lines directly on your charts for three key opening range periods:
- OR12 Targets (First 12 bars): 50% and 100% measured move targets with bullish (above range) and bearish (below range) projections
- OR18 Targets (First 18 bars): 50% and 100% measured move targets for extended range analysis
- Globex/Pre-market Targets: 50% and 100% targets based on overnight/pre-market range
2. Fully Customizable Line Appearance
Each target line set offers complete visual customization:
- Colors: Choose distinct colors for bullish/bearish and 50%/100% levels
- Line Styles: Solid, Dashed, or Dotted options
- Line Width: Adjustable thickness (1-4)
- Toggle Display: Show/hide each target set independently
3. Comprehensive Data Window for Backtesting
The Data Window now includes 38 critical metrics organized into 7 sections:
- Session Statistics: Gap %, GX Range %, OR12 Range %, OR18 Range %, Current Session %
- Breakout Detection: Gap Close Bar, PDH/PDL Breakout Bars, GXH/GXL Breakout Bars
- OR12 Target Hits: Bull/Bear Breakout Bars, 50% and 100% Target Hit Bars
- OR18 Target Hits: Bull/Bear Breakout Bars, 50% and 100% Target Hit Bars
- Globex Target Hits: 50% and 100% Bull/Bear Target Hit Bars
- Directional Indicators: OR Close vs Previous Day/Globex/Open
- EMA Analysis: Closes Above/Below EMA counts
Use Cases
For Day Traders:
- Identify key measured move targets for the trading session
- Track when price hits statistical profit targets
- Monitor opening range breakout confirmations
For Systematic Traders:
- Access complete bar-by-bar data for strategy development
- Backtest measured move strategies with precise target hit timing
- Analyze opening range dynamics across different timeframes
How to Use
1. Enable Target Lines: Use the "Target Lines" settings group to show/hide each target set
2. Customize Appearance: Adjust colors, styles, and widths in the respective settings groups (OR12, OR18, Globex)
3. Access Data Window: Open TradingView's Data Window (right sidebar) to view all metrics
4. Export for Analysis: Data Window values can be copied for external analysis and backtesting
Notes
- Target lines are calculated after their respective periods complete (bar 13 for OR12, bar 19 for OR18)
- Lines extend through the trading session and lock at session close
- All calculations reset each trading day
- Data Window metrics use 0 for events that haven't occurred, and the bar number when they do occur
Thank you for your continued support. Happy trading!
版本注释
Bug fix for plotting Globex levels and marking the bars that test them. 版本注释
Address bug in OR-18 calculations版本注释
Updated Globex calculations. 仅限邀请脚本
只有作者授权的用户才能访问此脚本。您需要申请并获得使用许可。通常情况下,付款后即可获得许可。更多详情,请按照下方作者的说明操作,或直接联系JR_PA。
TradingView不建议您付费购买或使用任何脚本,除非您完全信任其作者并了解其工作原理。您也可以在我们的社区脚本找到免费的开源替代方案。
作者的说明
If you would like to access this script, please DM me. It is part of the tool set we distribute when users sign up for their CAD subscriptions.
免责声明
这些信息和出版物并非旨在提供,也不构成TradingView提供或认可的任何形式的财务、投资、交易或其他类型的建议或推荐。请阅读使用条款了解更多信息。
仅限邀请脚本
只有作者授权的用户才能访问此脚本。您需要申请并获得使用许可。通常情况下,付款后即可获得许可。更多详情,请按照下方作者的说明操作,或直接联系JR_PA。
TradingView不建议您付费购买或使用任何脚本,除非您完全信任其作者并了解其工作原理。您也可以在我们的社区脚本找到免费的开源替代方案。
作者的说明
If you would like to access this script, please DM me. It is part of the tool set we distribute when users sign up for their CAD subscriptions.
免责声明
这些信息和出版物并非旨在提供,也不构成TradingView提供或认可的任何形式的财务、投资、交易或其他类型的建议或推荐。请阅读使用条款了解更多信息。