OPEN-SOURCE SCRIPT
Charles Recession Watch
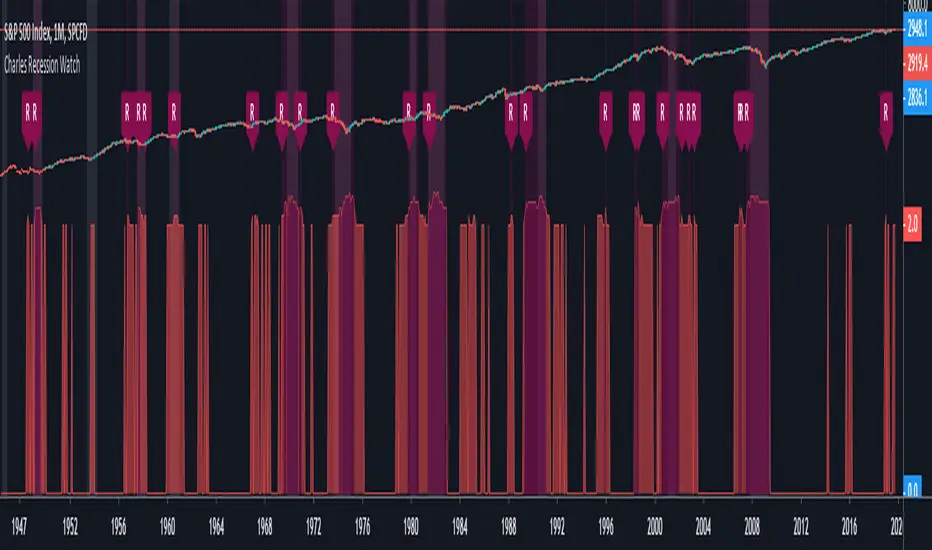
The “Recession Watch” indicator tracks 7 key economic metrics which have historically preceded US recessions. It provides a real-time indication of incoming recession risk.
This indicator gives a picture of when risk is increasing, and therefore when you might want to start taking some money out of risky assets.
All of the last seven recessions were preceded by a risk score of 3 or higher. Six of them were preceded by a risk score of 4 or higher. Unfortunately data prior to 1965 was inconsistent and prior recessions could not be considered.
Based on the indicator hit rate at successfully flagging recessions over the last 50 years, risk scores have the following approximate probabilities of recession:
- 0-1: Low
- 2: 25% within next 18 months
- 3: 30% within next 12 months
- 4-7: 50% within next 12 months
Note that a score of 3 is not necessarily a cause for panic. After all, there are substantial rewards to be had in the lead up to recessions (averaging 19% following yield curve inversion). For the brave, staying invested until the score jumps to 4+, or until the S&P500 drops below the 200day MA, will likely yield the best returns.
Notes on use:
- use MONTHLY time period only (the economic metrics are reported monthly)
- If you want to view the risk Score (1-7) you need to set your chart axis to "Logarithmic"
Enjoy and good luck!
开源脚本
秉承TradingView的精神,该脚本的作者将其开源,以便交易者可以查看和验证其功能。向作者致敬!您可以免费使用该脚本,但请记住,重新发布代码须遵守我们的网站规则。
免责声明
这些信息和出版物并非旨在提供,也不构成TradingView提供或认可的任何形式的财务、投资、交易或其他类型的建议或推荐。请阅读使用条款了解更多信息。
开源脚本
秉承TradingView的精神,该脚本的作者将其开源,以便交易者可以查看和验证其功能。向作者致敬!您可以免费使用该脚本,但请记住,重新发布代码须遵守我们的网站规则。
免责声明
这些信息和出版物并非旨在提供,也不构成TradingView提供或认可的任何形式的财务、投资、交易或其他类型的建议或推荐。请阅读使用条款了解更多信息。