OPEN-SOURCE SCRIPT
LSMA Crossover
This is a simple script designed to help filter out bad trades. LSMA is a trend king and by using the 21,200 and 1000 length lines traders can get a clear view of where price action is travelling. This indicator is the perfect companion to the LSMA Wave Rider indicator. Once a pullback is discovered (price action crosses under blue or white line) Traders can use LSMA Wave Rider to locate perfect entry point.
Least Squares Moving Average follows these rules:
When price crosses over it signals a bull trend.
When price crosses under it signals bear trend.
When price stays close or on the line sideways action is to be expected.
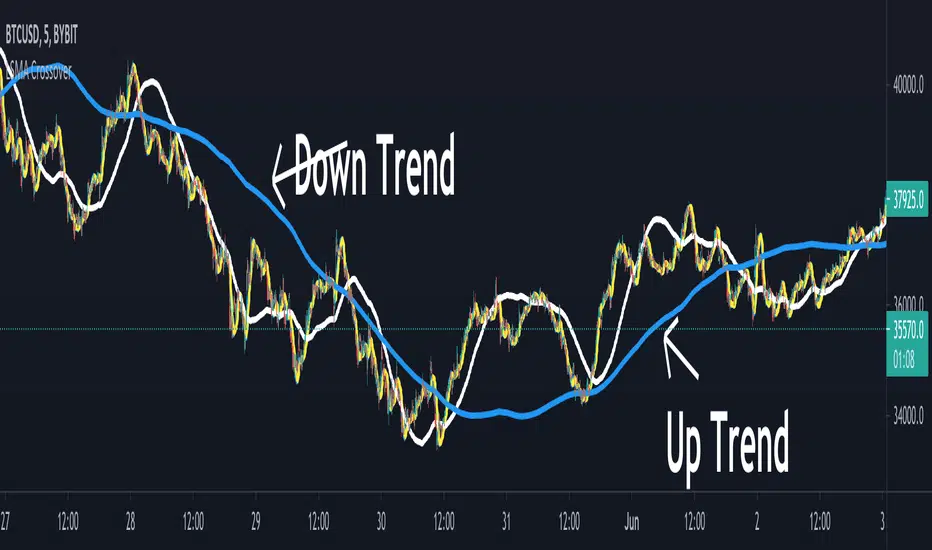
The direction of the line shows the direction of the trend.

Here is an example of finding good trades. Price action pulls below white or blue line.

Another example of what a pullback looks like.

This example shows how to find trend using crossovers.

Another example how trend can be found but by using line direction.
LSMA Wave Rider can be found here:

Least Squares Moving Average follows these rules:
When price crosses over it signals a bull trend.
When price crosses under it signals bear trend.
When price stays close or on the line sideways action is to be expected.
The direction of the line shows the direction of the trend.
Here is an example of finding good trades. Price action pulls below white or blue line.
Another example of what a pullback looks like.
This example shows how to find trend using crossovers.
Another example how trend can be found but by using line direction.
LSMA Wave Rider can be found here:
开源脚本
秉承TradingView的精神,该脚本的作者将其开源,以便交易者可以查看和验证其功能。向作者致敬!您可以免费使用该脚本,但请记住,重新发布代码须遵守我们的网站规则。
免责声明
这些信息和出版物并非旨在提供,也不构成TradingView提供或认可的任何形式的财务、投资、交易或其他类型的建议或推荐。请阅读使用条款了解更多信息。
免责声明
这些信息和出版物并非旨在提供,也不构成TradingView提供或认可的任何形式的财务、投资、交易或其他类型的建议或推荐。请阅读使用条款了解更多信息。