OPEN-SOURCE SCRIPT
已更新 HVC Daily Levels
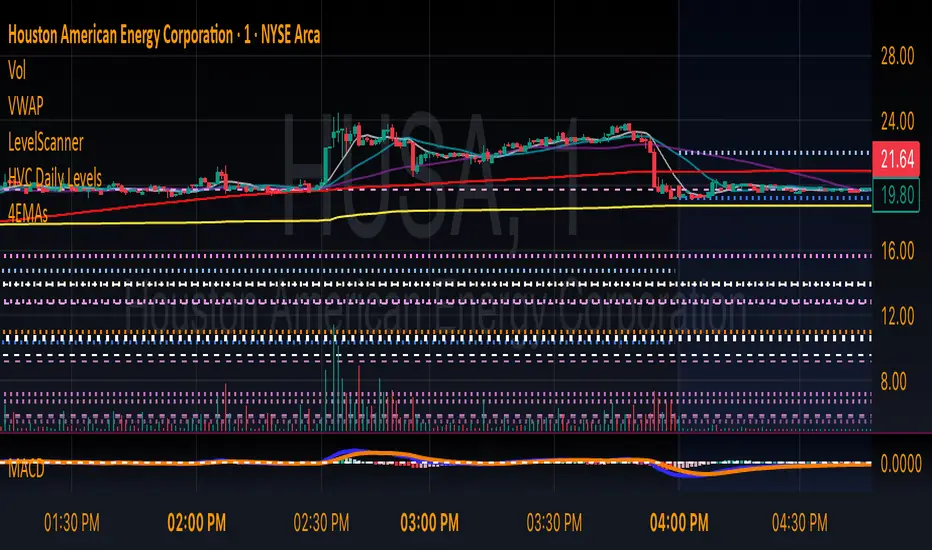
Daily High Volume Candle Levels Marked on all Timeframes
HVC Level Sentinel v6 — High Volume Candle Levels
HVC Level Sentinel v6 automatically detects and highlights “High Volume Candles” (HVCs) — bars with the highest trading volume in a rolling, user-defined window (e.g., 30 days). This tool helps you spot key price levels where significant trading activity occurred, which can act as important support or resistance zones.
Features
Customizable Lookback: Choose how many bars to look back for HVC detection (default: 30 days, adjustable).
Automatic Highlighting: HVC candles are highlighted on your chart with a customizable color.
Level Lines: Draws horizontal lines at the Open, High, Low, and Close of each recent HVC, so you can easily track these key levels.
Line Fading: Only the most recent N HVCs (user-adjustable) have lines, with older lines fading out or disappearing for clarity.
Per-Line Control: Turn on/off Open, High, Low, and Close lines individually in the settings.
Fully Customizable: Adjust colors, line styles, widths, and opacity to fit your chart style.
How It Works
On each new bar, the script checks if the current bar’s volume is the highest in the last N bars.
If so, it marks the bar as an HVC and draws lines at its O/H/L/C (if enabled).
You can highlight all HVCs historically, but only the most recent N will have lines for a clean, focused chart.
Use Cases
Identify major breakout or reversal points driven by high volume.
Track where institutional or “smart money” activity may have occurred.
Use HVC levels as dynamic support/resistance for entries, exits, or stop placement.
Tip:
Adjust the lookback window and number of HVCs with lines to match your trading style—shorter for active trading, longer for swing/position trading.
版本注释
Daily High Volume Candle Levels Marked on all TimeframesHVC Level Sentinel v6 — High Volume Candle Levels
HVC Level Sentinel v6 automatically detects and highlights “High Volume Candles” (HVCs) — bars with the highest trading volume in a rolling, user-defined window (e.g., 30 days). This tool helps you spot key price levels where significant trading activity occurred, which can act as important support or resistance zones.
Features
Customizable Lookback: Choose how many bars to look back for HVC detection (default: 30 days, adjustable).
Automatic Highlighting: HVC candles are highlighted on your chart with a customizable color.
Level Lines: Draws horizontal lines at the Open, High, Low, and Close of each recent HVC, so you can easily track these key levels.
Line Fading: Only the most recent N HVCs (user-adjustable) have lines, with older lines fading out or disappearing for clarity.
Per-Line Control: Turn on/off Open, High, Low, and Close lines individually in the settings.
Fully Customizable: Adjust colors, line styles, widths, and opacity to fit your chart style.
How It Works
On each new bar, the script checks if the current bar’s volume is the highest in the last N bars.
If so, it marks the bar as an HVC and draws lines at its O/H/L/C (if enabled).
You can highlight all HVCs historically, but only the most recent N will have lines for a clean, focused chart.
Use Cases
Identify major breakout or reversal points driven by high volume.
Track where institutional or “smart money” activity may have occurred.
Use HVC levels as dynamic support/resistance for entries, exits, or stop placement.
Tip:
Adjust the lookback window and number of HVCs with lines to match your trading style—shorter for active trading, longer for swing/position trading.
开源脚本
秉承TradingView的精神,该脚本的作者将其开源,以便交易者可以查看和验证其功能。向作者致敬!您可以免费使用该脚本,但请记住,重新发布代码须遵守我们的网站规则。
免责声明
这些信息和出版物并非旨在提供,也不构成TradingView提供或认可的任何形式的财务、投资、交易或其他类型的建议或推荐。请阅读使用条款了解更多信息。
免责声明
这些信息和出版物并非旨在提供,也不构成TradingView提供或认可的任何形式的财务、投资、交易或其他类型的建议或推荐。请阅读使用条款了解更多信息。