INVITE-ONLY SCRIPT
Varma Fractal TEMA Indicator
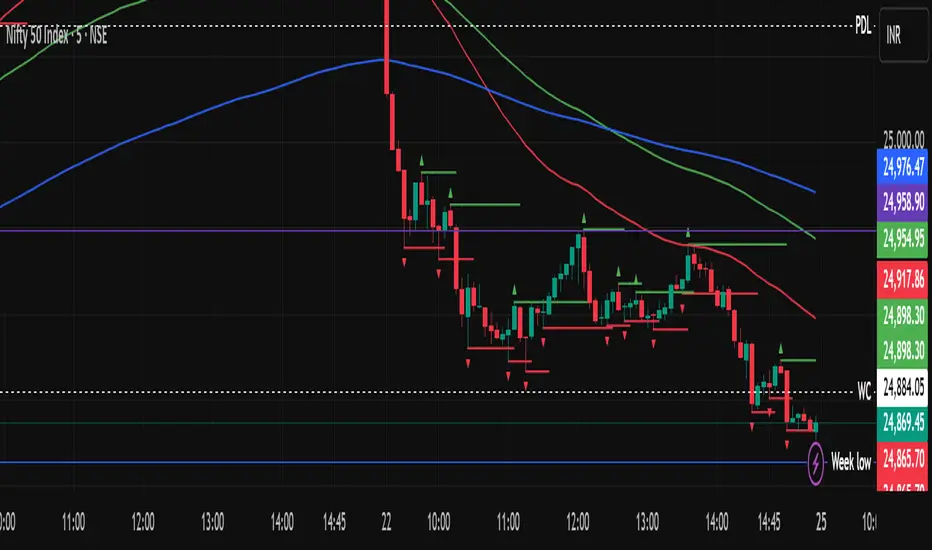
The Indicator uses Fractals and Three EMAs. A fractal is a repeating price pattern, typically consisting of five candlesticks, used to identify potential trend reversals or continuations. A bullish fractal suggests a possible upward price movement, while a bearish fractal indicates a potential downward trend. These patterns, popularized by Bill Williams, can be found across different timeframes and are considered a key part of his technical analysis system. Every Fractal line acts as an immediate support or resistance. The use of three EMAs in trading is well known. One can make own strategies with them.
仅限邀请脚本
只有作者授权的用户才能访问此脚本。您需要申请并获得使用许可。通常情况下,付款后即可获得许可。更多详情,请按照下方作者的说明操作,或直接联系varmasudhakar。
TradingView不建议您付费购买或使用任何脚本,除非您完全信任其作者并了解其工作原理。您也可以在我们的社区脚本找到免费的开源替代方案。
作者的说明
ENTRY FOR LONG:(When the price is above 200 EMA and above 20 EMA line :Source: High in settings) *At the close of the green candle, which crosses the nearest green fractal level
ENTRY FOR SHORT: (When the price is below the 200 EMA and 20 EMA) in reverse
免责声明
这些信息和出版物并非旨在提供,也不构成TradingView提供或认可的任何形式的财务、投资、交易或其他类型的建议或推荐。请阅读使用条款了解更多信息。