OPEN-SOURCE SCRIPT
Market Pressure Differential (MPD) [SharpStrat]

Market Pressure Differential (MPD)
Concept & Purpose
In simple terms:
Calculation Overview
MPD uses a structural candle formula to compute directional pressure:
Then it applies:
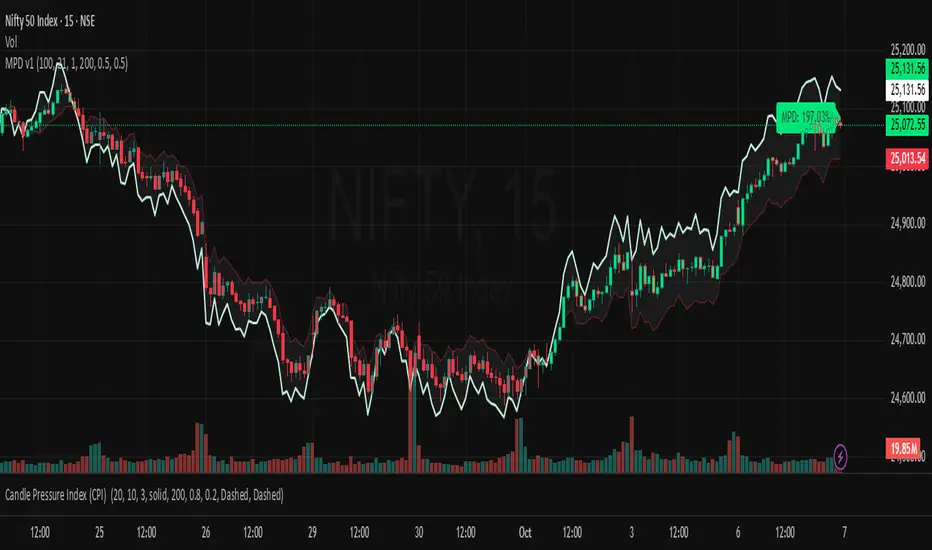
This produces the MPD projection line and the pressure ribbon, drawn directly on the main chart.
Customizable Inputs
Users can adjust color schemes, EMA smoothing length, ATR parameters, normalization length, and body/wick weighting to adapt the indicator’s sensitivity and aesthetic to different markets or chart themes.
How to Use
The Market Pressure Differential (MPD) visualizes the real-time balance between buying and selling pressure. It should be used as a contextual bias tool, not a standalone signal generator.
MPD reacts quickly to candle structure, so trend bias is based on how its projection behaves relative to the ATR envelope:
The MPD percentage in the label represents the normalized strength of pressure relative to recent volatility.
To trade with MPD:
This helps reveal which side controls the market and whether that pressure is strong enough to overcome typical volatility.
Disclaimer
Concept & Purpose
- The Market Pressure Differential (MPD) is a proprietary indicator designed to measure the internal balance of buying and selling pressure directly on the price chart.
- Unlike standard momentum or trend indicators, MPD analyzes the structural behavior of each candle—its body, wicks, and overall range—to determine whether the market is dominated by expansion (buying aggression) or contraction (selling absorption).
- This indicator provides a visual overlay of market pressure that adapts dynamically to volatility, helping traders see real-time shifts in participation intensity without using oscillators.
In simple terms:
- When MPD expands upward → buyer pressure dominates.
- When MPD contracts downward → seller pressure dominates.
Calculation Overview
MPD uses a structural candle formula to compute directional pressure:
Body Ratio = (Close − Open) / (High − Low)
Wick Differential = (Lower Wick − Upper Wick) / (High − Low)
Raw Pressure = (Body Ratio × Body Weight) + (Wick Differential × Wick Weight)
Then it applies:
- EMA smoothing (to stabilize short-term noise)
- Standard deviation normalization (to maintain consistent scaling)
- ATR projection (to adapt the signal visually to volatility)
This produces the MPD projection line and the pressure ribbon, drawn directly on the main chart.
Customizable Inputs
Users can adjust color schemes, EMA smoothing length, ATR parameters, normalization length, and body/wick weighting to adapt the indicator’s sensitivity and aesthetic to different markets or chart themes.
How to Use
The Market Pressure Differential (MPD) visualizes the real-time balance between buying and selling pressure. It should be used as a contextual bias tool, not a standalone signal generator.
- The white line represents the MPD projection, showing how market pressure evolves in real time based on candle structure and volatility.
- The red line represents the ATR envelope, which defines the market’s expected volatility range.
MPD reacts quickly to candle structure, so trend bias is based on how its projection behaves relative to the ATR envelope:
- Above the ATR band → positive pressure and bullish bias.
- Below the ATR band → negative pressure and bearish bias.
- Hovering near the ATR band → neutral or indecisive conditions.
The MPD percentage in the label represents the normalized strength of pressure relative to recent volatility.
- Positive % = buying dominance.
- Negative % = selling dominance.
- Higher absolute values = stronger momentum compared to volatility.
To trade with MPD:
- Watch candle colors and the projection line — green or positive % shows buyer control, red or negative % shows seller control.
- Note transitions above or below the ATR level for early signs of momentum shifts.
- Combine MPD signals with price structure, key levels, or volume for confirmation.
This helps reveal which side controls the market and whether that pressure is strong enough to overcome typical volatility.
Disclaimer
- It introduces a novel structural–pressure approach to visualizing market dynamics.
- For educational and analytical purposes only; this does not constitute financial advice.
开源脚本
秉承TradingView的精神,该脚本的作者将其开源,以便交易者可以查看和验证其功能。向作者致敬!您可以免费使用该脚本,但请记住,重新发布代码须遵守我们的网站规则。
I create free Trading View indicators for the community. Your idea could be next! Submit → forms.gle/aE69zwHrfASScj8T7
免责声明
这些信息和出版物并非旨在提供,也不构成TradingView提供或认可的任何形式的财务、投资、交易或其他类型的建议或推荐。请阅读使用条款了解更多信息。
开源脚本
秉承TradingView的精神,该脚本的作者将其开源,以便交易者可以查看和验证其功能。向作者致敬!您可以免费使用该脚本,但请记住,重新发布代码须遵守我们的网站规则。
I create free Trading View indicators for the community. Your idea could be next! Submit → forms.gle/aE69zwHrfASScj8T7
免责声明
这些信息和出版物并非旨在提供,也不构成TradingView提供或认可的任何形式的财务、投资、交易或其他类型的建议或推荐。请阅读使用条款了解更多信息。