PROTECTED SOURCE SCRIPT
TTL Quad stochastic
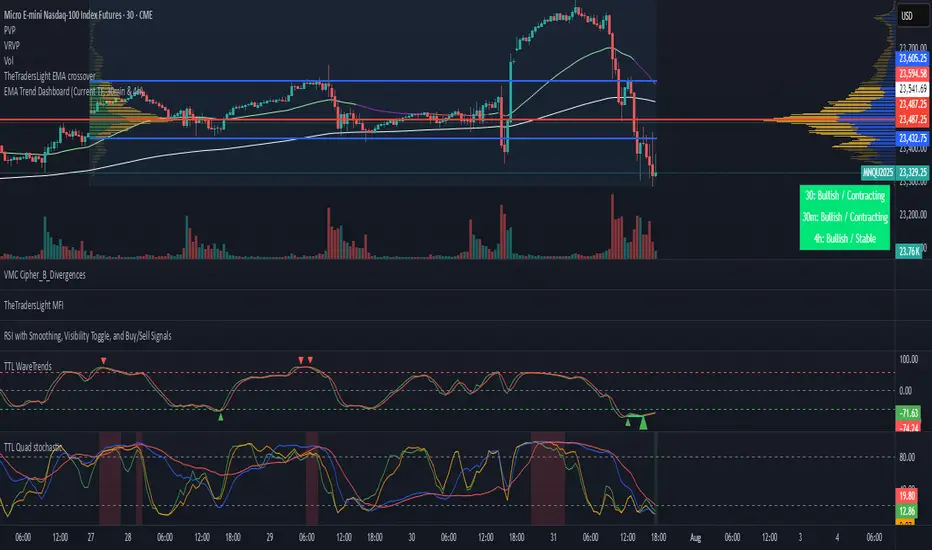
🧠 The Traders' Light — Quad Stochastic Viewer v2
Script name: TTL Quad Stochastic
Version: v2
Author: The Traders’ Light
Follow us: TheTradersLight on X
🎯 What it does
This script visualizes four smoothed stochastic indicators on a single pane, providing a unique multi-speed momentum perspective. It’s designed to help traders identify high-confluence overbought/oversold conditions, especially when all stochastic curves align in extreme zones.
📐 Indicators used
The script calculates and displays the following smoothed stochastics:
Stoch 9-3 — fast reaction
Stoch 14-3 — standard
Stoch 40-4 — mid-term filter
Stoch 60-10 — long-term context
Overbought and oversold levels are visually marked at 80 and 20, respectively.
🔔 Signal logic
Background highlights are triggered when all four stochastics align:
✅ Green background when all stochastics are below 20 (oversold)
❌ Red background when all stochastics are above 80 (overbought)
Webhook alerts are also available:
Bullish Align Alert when all stochastics < 20
Bearish Align Alert when all stochastics > 80
🔧 How to use it
Use this tool as a momentum filter to confirm entries or avoid low-confluence zones. Combine it with trend structure, volume, or other TTL indicators for optimal setups.
⚠️ Important
This is not a buy/sell signal indicator. It is a visual aid intended to support your analysis, not to replace it.
Always use in conjunction with your own strategy and risk management.
Trading involves significant risk and may result in financial loss.
Use at your own discretion and responsibility.
受保护脚本
此脚本以闭源形式发布。 但是,您可以自由使用,没有任何限制 — 了解更多信息这里。
免责声明
这些信息和出版物并非旨在提供,也不构成TradingView提供或认可的任何形式的财务、投资、交易或其他类型的建议或推荐。请阅读使用条款了解更多信息。
受保护脚本
此脚本以闭源形式发布。 但是,您可以自由使用,没有任何限制 — 了解更多信息这里。
免责声明
这些信息和出版物并非旨在提供,也不构成TradingView提供或认可的任何形式的财务、投资、交易或其他类型的建议或推荐。请阅读使用条款了解更多信息。