PROTECTED SOURCE SCRIPT
已更新 Direction Analysis Waves
Description
It is an indicator that aims to provide information about the direction of the trend, the basis of which is the CCI, CMO and MFI indices.
Symbols on the indicator are for informational purposes. Information about colors and symbols is given below.
Warning
As a result, this indicator should be expected to give an idea of the trend direction, not a trading signal.
Version
v1.0
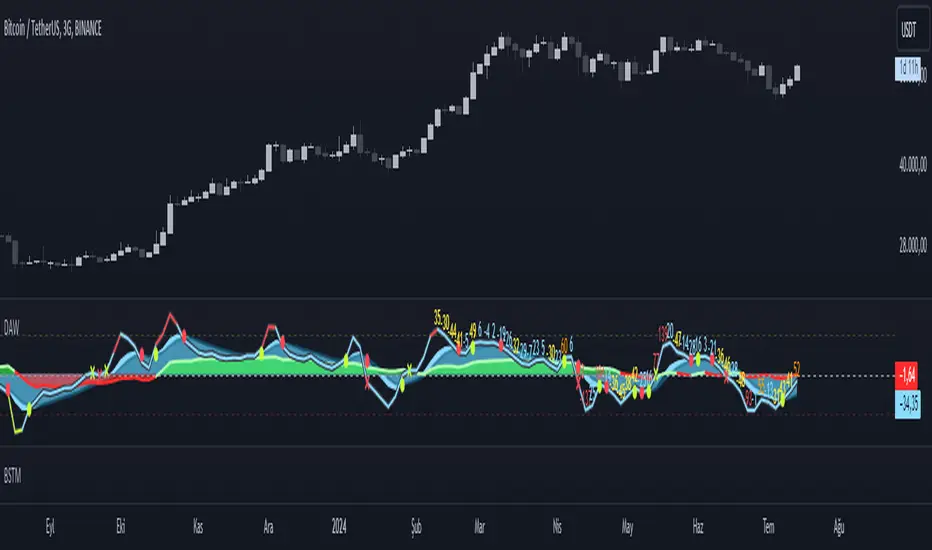
It is an indicator that aims to provide information about the direction of the trend, the basis of which is the CCI, CMO and MFI indices.
Symbols on the indicator are for informational purposes. Information about colors and symbols is given below.
- Blue Wave: Graphical representation of the Commodity Channel Index (CCI) curve.
- Green/Red Wave: Graphical representation of the Chande Momentum Oscillator (CMO) curve. This curve turns green when it rises above zero, and turns red when it falls below zero.
- Yellow Wave: Graphical representation of the Money Flow Index (MFI) curve.
- Blue Line: CCI line.
- Green/Red Cross: CCI line shows green cross on red cross below 0 value.
Warning
As a result, this indicator should be expected to give an idea of the trend direction, not a trading signal.
Version
v1.0
版本注释
- [ADDED] Added horizontal lines above 200 and -200 values.
版本注释
- Values showing the amount of change according to the previous position of the line on the Commodity Channel Index (CCI) line have been added.
- 30 < Blue
- 30 - 50 Yellow
- 50 - 70 Orange
- 70 > Red
版本注释
- Objects on the display can be turned on or off from the settings menu and their colors can be changed.
版本注释
- CCI length has been increased from 13 to 14 as it gives more accurate results.
版本注释
- Title edited.
版本注释
- Added numbers indicating possible strength of direction.
版本注释
- The numbers showing the possible strength of the direction have been recalculated.
版本注释
- Improved the intersection of CCI waves.
- Changes were made to the line color as CCI cut the overbought and oversold lines.
版本注释
- Wave return levels have been improved.
版本注释
Multiplier values have been removed.版本注释
ohlc4 and hlc3 values have been updated to produce values according to standard candlestick charts, independent of candlestick charts.版本注释
- Removed invalid variables
版本注释
- Changed Indicator Title
版本注释
- The bug that caused incorrect counting backwards of numbers has been fixed.
版本注释
- Fixed rutime error.
版本注释
- Added Turn Signal Type options.
版本注释
- The isCCILine option now also affects the visibility of symbols belonging to the CCI line.
版本注释
- A line called the Trend Index has been added, which moves between -200 and 200 and gives information about the depth of the trend, indicating overbought when it approaches 200, and oversold when it approaches -200.
版本注释
- Fixed MFI values.
受保护脚本
此脚本以闭源形式发布。 但是,您可以自由使用,没有任何限制 — 了解更多信息这里。
免责声明
这些信息和出版物并非旨在提供,也不构成TradingView提供或认可的任何形式的财务、投资、交易或其他类型的建议或推荐。请阅读使用条款了解更多信息。
受保护脚本
此脚本以闭源形式发布。 但是,您可以自由使用,没有任何限制 — 了解更多信息这里。
免责声明
这些信息和出版物并非旨在提供,也不构成TradingView提供或认可的任何形式的财务、投资、交易或其他类型的建议或推荐。请阅读使用条款了解更多信息。