OPEN-SOURCE SCRIPT
Cryptogenik's Inflation-Adjusted Candles v2025
Inflation-Adjusted Price Indicator by Cryptogenik
This indicator adjusts price data for inflation, allowing you to visualize how stock/asset prices would look with constant purchasing power. By using Consumer Price Index (CPI) data from FRED, it transforms nominal prices into inflation-adjusted values that reflect real-world purchasing power.
What This Indicator Does
The Inflation-Adjusted Price indicator converts traditional price charts to show what prices would be if the purchasing power of currency remained constant. This is essential for long-term analysis, as it removes the distortion caused by inflation when comparing prices across different time periods.
Key Features
How To Use It
This indicator is particularly valuable for analyzing stocks, commodities, and other assets over periods of 5+ years, where inflation effects become significant. It helps answer the question: "Has this asset truly increased in value, or is the price increase just reflecting inflation?"
Technical Details
The indicator calculates adjusted prices using the formula: (price / CPI) * 100, which effectively shows prices as a percentage of current purchasing power. This approach normalizes all prices to a consistent standard, making historical comparisons more meaningful.
Cryptogenik's Inflation-Adjusted Candles v2025
This indicator adjusts price data for inflation, allowing you to visualize how stock/asset prices would look with constant purchasing power. By using Consumer Price Index (CPI) data from FRED, it transforms nominal prices into inflation-adjusted values that reflect real-world purchasing power.
What This Indicator Does
The Inflation-Adjusted Price indicator converts traditional price charts to show what prices would be if the purchasing power of currency remained constant. This is essential for long-term analysis, as it removes the distortion caused by inflation when comparing prices across different time periods.
Key Features
- Displays inflation-adjusted price candles alongside original prices
- Uses official CPI data from the Federal Reserve (FRED:CPIAUCSL)
- Allows easy comparison between nominal and real prices
- Helps identify true price movements by filtering out the effects of inflation
- Perfect for long-term investors and macroeconomic analysis
How To Use It
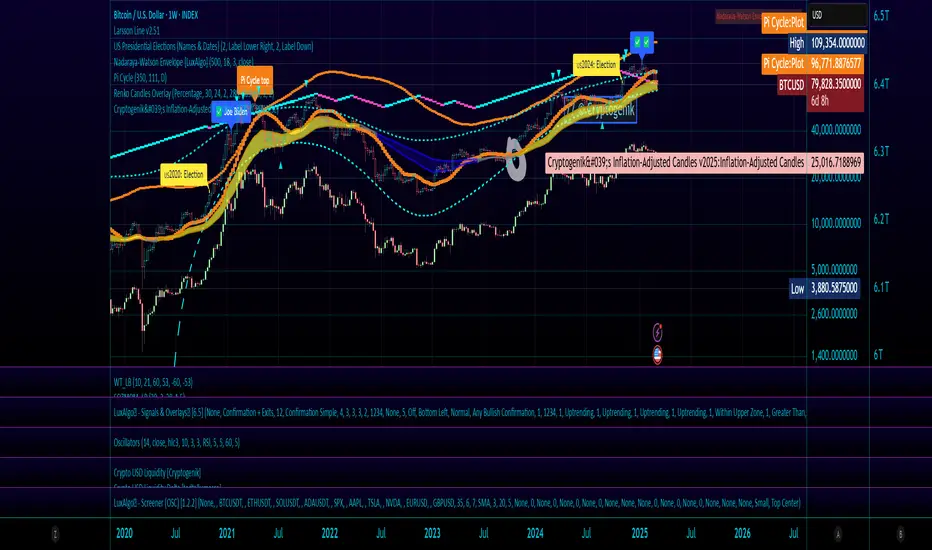
- Apply the indicator to any chart
- Green/red candles show the inflation-adjusted prices
- Gray line shows the original unadjusted price
- The information label displays the current CPI value
This indicator is particularly valuable for analyzing stocks, commodities, and other assets over periods of 5+ years, where inflation effects become significant. It helps answer the question: "Has this asset truly increased in value, or is the price increase just reflecting inflation?"
Technical Details
The indicator calculates adjusted prices using the formula: (price / CPI) * 100, which effectively shows prices as a percentage of current purchasing power. This approach normalizes all prices to a consistent standard, making historical comparisons more meaningful.
Cryptogenik's Inflation-Adjusted Candles v2025
开源脚本
秉承TradingView的精神,该脚本的作者将其开源,以便交易者可以查看和验证其功能。向作者致敬!您可以免费使用该脚本,但请记住,重新发布代码须遵守我们的网站规则。
免责声明
这些信息和出版物并非旨在提供,也不构成TradingView提供或认可的任何形式的财务、投资、交易或其他类型的建议或推荐。请阅读使用条款了解更多信息。
开源脚本
秉承TradingView的精神,该脚本的作者将其开源,以便交易者可以查看和验证其功能。向作者致敬!您可以免费使用该脚本,但请记住,重新发布代码须遵守我们的网站规则。
免责声明
这些信息和出版物并非旨在提供,也不构成TradingView提供或认可的任何形式的财务、投资、交易或其他类型的建议或推荐。请阅读使用条款了解更多信息。