OPEN-SOURCE SCRIPT
HTF Trend Tracker [BigBeluga]
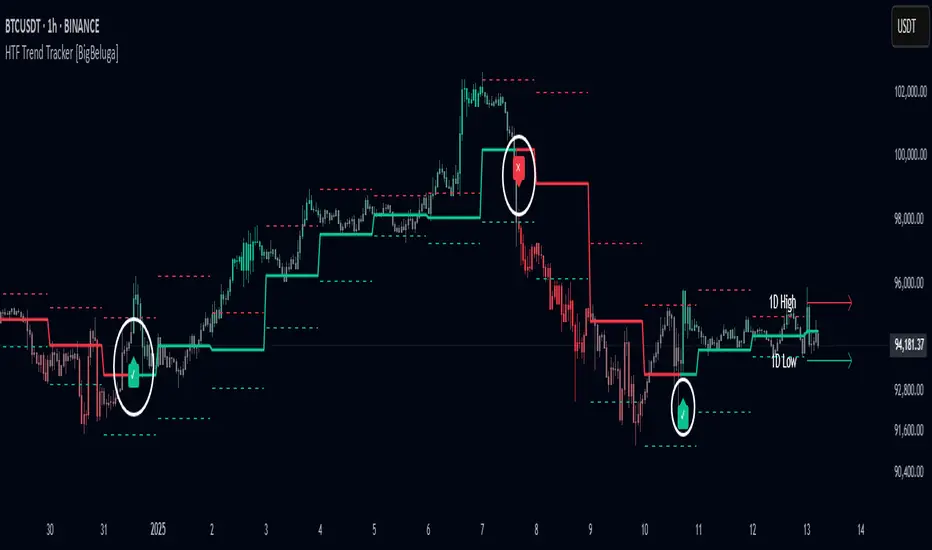
HTF Trend Tracker [BigBeluga] is a higher timeframe (HTF) trend tracking indicator designed to help traders identify significant trends, key levels, and market sentiment. The indicator dynamically adapts to the current price action, using HTF highs and lows to display trend direction and strength with detailed visuals.

🔵Key Features:
Dynamic Trend Detection:
Historical and Active HTF Levels:
🔵Key Features:
Dynamic Trend Detection:
- Uptrend is identified when the price closes above the HTF high.
- Downtrend is detected when the price closes below the HTF low.
- Midline changes color dynamically based on the trend direction:
- Bullish Green: Indicates an uptrend.
- Bearish Red: Indicates a downtrend.
Historical and Active HTF Levels:
- Historic HTF highs and lows are displayed as dotted lines.
- Current active HTF high and low levels are shown as solid lines.
- Timeframe labels (e.g., "1D High" or "1D Low") mark the active levels for clarity.
Trend Change Signals:
- A green checkmark (✓) is plotted when an uptrend starts.
- A red cross (✕) appears when a downtrend begins.
- Candle colors change dynamically based on the trend and the price's distance from the midline:
- Intense Bullish Green: Price is far above the midline during an uptrend.
- Intense Bearish Red: Price is far below the midline during a downtrend.
- Neutral Gray: Price is near the midline.
- Users can customize the colors to suit their preferences.
🔵Usage:- Identify uptrends and downtrends using the midline's color and the position of the close relative to the HTF levels.
- Use solid lines and timeframe labels to track current HTF high and low levels.
- Observe dotted lines for historical HTF levels to understand past price behavior.
- Watch for checkmark (✓) and cross (✕) signals to spot trend changes and key market shifts.
- Monitor candle colors to gauge trend intensity and proximity to the midline:
- Intense colors signal strong trends, while neutral gray indicates consolidation near the midline.
- A green checkmark (✓) is plotted when an uptrend starts.
开源脚本
秉承TradingView的精神,该脚本的作者将其开源,以便交易者可以查看和验证其功能。向作者致敬!您可以免费使用该脚本,但请记住,重新发布代码须遵守我们的网站规则。
🔵Gain access to our powerful tools : bigbeluga.com/tv
🔵Join our free discord for updates : bigbeluga.com/discord
All scripts & content provided by BigBeluga are for informational & educational purposes only.
🔵Join our free discord for updates : bigbeluga.com/discord
All scripts & content provided by BigBeluga are for informational & educational purposes only.
免责声明
这些信息和出版物并非旨在提供,也不构成TradingView提供或认可的任何形式的财务、投资、交易或其他类型的建议或推荐。请阅读使用条款了解更多信息。