INVITE-ONLY SCRIPT
已更新 LONG - MasterChartsTrading
LONG - MasterChartsTrading
版本注释
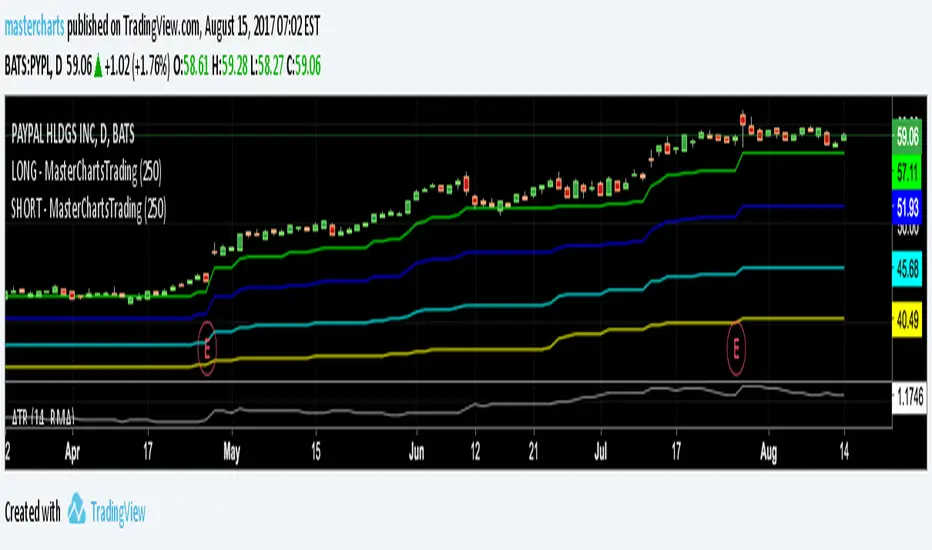
MasterChartsTrading Price Action Indicators show good price levels to enter or exit at trade. The Blue indicator line serves as a Bullish Trend setter.
If your instrument closes above the Blue line, we think about going Long (buying).
For commodities and Forex, when your trading instrument closes below the Red line, we think about Shorting (selling).
For Stocks, I prefer to use the Yellow line as my Bearish Trend setter (on Daily charts ).
Find out more! Send Private Mail (PM) to mastercharts
仅限邀请脚本
只有作者授权的用户才能访问此脚本。您需要申请并获得使用许可。通常情况下,付款后即可获得许可。更多详情,请按照下方作者的说明操作,或直接联系mastercharts。
TradingView不建议您付费购买或使用任何脚本,除非您完全信任其作者并了解其工作原理。您也可以在我们的社区脚本找到免费的开源替代方案。
作者的说明
FREE Trial of These Indicators. Sign-Up for access here: masterchartstrading.com/store/c1/Featured_Products.html
Visit my financial blog & get alerts : masterchartstrading.com/blog
@mastercharts
Visit my financial blog & get alerts : masterchartstrading.com/blog
@mastercharts
免责声明
这些信息和出版物并非旨在提供,也不构成TradingView提供或认可的任何形式的财务、投资、交易或其他类型的建议或推荐。请阅读使用条款了解更多信息。